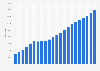
Per capita sales volume in the Hot Drinks market Finland 2018-2028
Significant fluctuations are estimated for all segments over the forecast period for the indicator 'Volume per Capita, Combined'. Only for the segment Cocoa, a significant increase can be observed over the forecast period. Here, the indicator exhibits a difference of 0.1 U.S. dollars between 2018 and 2028.
The Statista Market Insights cover a broad range of additional markets.
The Statista Market Insights cover a broad range of additional markets.