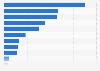
Production volume of secondary aluminum in Europe reached some 2.6 million metric tons in 2020. This was a year-on-year dip of 15 percent compared to 2019, when the region produced over three million metric tons of secondary aluminum.
Production of secondary aluminum in Europe from 2011 to 2020 (in 1,000 metric tons)*
Basic Account
Get to know the platform
You only have access to basic statistics.
This statistic is not included in your account.
Starter Account
The ideal entry-level account for individual users
- Instant access to 1m statistics
- Download in XLS, PDF & PNG format
- Detailed references
$199 USD / Month *
Professional Account
Full access
Business Solutions including all features.
* Prices do not include sales tax.
Other statistics that may interest you Statistics on
About the industry
10
- Premium Statistic Bauxite imports to the United States 2010-2021
- Basic Statistic Alumina imports to the United States 2011-2021
- Premium Statistic Primary aluminum production in Russia 2009-2021
- Premium Statistic Secondary aluminum production in Poland 2009-2021
- Premium Statistic Primary aluminum production in Europe 2010-2021
- Premium Statistic Primary aluminum production in Europe 2021, by country
- Premium Statistic Secondary aluminum production in Spain 2009-2020
- Premium Statistic Aluminum production in Europe 2009-2020
- Premium Statistic Secondary aluminum production in Croatia 2009-2019
- Premium Statistic Secondary aluminum production in Finland 2009-2019
About the region
10
- Premium Statistic Alumina production in Europe 2009-2020
- Premium Statistic Bauxite production in Europe 2009-2018
- Premium Statistic Primary aluminum consumption in Europe 2021, by country
- Premium Statistic Aluminum exports from Europe 2021, by country
- Premium Statistic Aluminum imports to Europe by country 2021
- Premium Statistic Aluminum and semi alloy imports to Europe 2019, by country
- Premium Statistic Aluminum and semi alloy exports from Europe 2018, by country
- Basic Statistic EU: turnover of metal forming machinery manufacturing 2011-2018
- Premium Statistic Recycling rate of aluminum cans in Europe 2020, by country
- Premium Statistic Magnitogorsk Iron & Steel Works (MMK) revenue 2007-2021
Selected statistics
2
Other regions
10
- Premium Statistic Secondary aluminum production in Sweden 2009-2019
- Premium Statistic Secondary aluminum production in Denmark 2009-2018
- Premium Statistic Secondary aluminum production in the United Kingdom 2009-2019
- Premium Statistic Bauxite imports by Spain 2006-2015
- Premium Statistic Secondary aluminum production in Serbia 2009-2018
- Premium Statistic Secondary aluminum production in Portugal 2009-2018
- Premium Statistic Secondary aluminum production in France 2009-2018
- Premium Statistic Secondary aluminum production in Czechia 2009-2018
- Premium Statistic Secondary aluminum production in Austria 2009-2018
- Premium Statistic Secondary aluminum production in Norway 2009-2019
Related statistics
10
- Premium Statistic Secondary aluminum production in Germany 2009-2019
- Premium Statistic Secondary aluminum production in Italy 2009-2019
- Premium Statistic Aluminum casting production in Italy 2006-2017
- Premium Statistic Iron and steel scrap: exports from the U.S. 2006-2022
- Premium Statistic Global imports and exports of unwrought aluminum and aluminum alloys 2005-2021
- Premium Statistic Iron and steel recycling value in the U.S. 2005-2019
- Premium Statistic Aluminum and semi alloy exports from Spain 2009-2020
- Premium Statistic Aluminum and semi alloy imports to Spain 2009-2020
- Premium Statistic Refined aluminum consumption in Italy 2006-2020
- Premium Statistic Refined aluminum consumption in the United Kingdom 2006-2020
Further related statistics
10
- Number of Rio Tinto's employees 2010-2023
- Rio Tinto's aluminum and copper production 2010-2023
- Rio Tinto's net income 2001-2023
- U.S. cement production volume 2010-2023
- Comparison of cobalt consumption in the U.S. 2010-2023
- Global clinker production capacity in selected countries 2022
- Rio Tinto's uranium production 2010-2023
- Rio Tinto's diamond production 2010-2023
- Iron ore prices 2000-2022
- Thermal coal prices 2013-2022
Further Content: You might find this interesting as well
Statistics
- Number of Rio Tinto's employees 2010-2023
- Rio Tinto's aluminum and copper production 2010-2023
- Rio Tinto's net income 2001-2023
- U.S. cement production volume 2010-2023
- Comparison of cobalt consumption in the U.S. 2010-2023
- Global clinker production capacity in selected countries 2022
- Rio Tinto's uranium production 2010-2023
- Rio Tinto's diamond production 2010-2023
- Iron ore prices 2000-2022
- Thermal coal prices 2013-2022
World Bureau of Metal Statistics. (May 4, 2021). Production of secondary aluminum in Europe from 2011 to 2020 (in 1,000 metric tons)* [Graph]. In Statista. Retrieved April 18, 2024, from https://www.statista.com/statistics/1028859/europe-secondary-aluminum-production/
World Bureau of Metal Statistics. "Production of secondary aluminum in Europe from 2011 to 2020 (in 1,000 metric tons)*." Chart. May 4, 2021. Statista. Accessed April 18, 2024. https://www.statista.com/statistics/1028859/europe-secondary-aluminum-production/
World Bureau of Metal Statistics. (2021). Production of secondary aluminum in Europe from 2011 to 2020 (in 1,000 metric tons)*. Statista. Statista Inc.. Accessed: April 18, 2024. https://www.statista.com/statistics/1028859/europe-secondary-aluminum-production/
World Bureau of Metal Statistics. "Production of Secondary Aluminum in Europe from 2011 to 2020 (in 1,000 Metric Tons)*." Statista, Statista Inc., 4 May 2021, https://www.statista.com/statistics/1028859/europe-secondary-aluminum-production/
World Bureau of Metal Statistics, Production of secondary aluminum in Europe from 2011 to 2020 (in 1,000 metric tons)* Statista, https://www.statista.com/statistics/1028859/europe-secondary-aluminum-production/ (last visited April 18, 2024)
Production of secondary aluminum in Europe from 2011 to 2020 (in 1,000 metric tons)* [Graph], World Bureau of Metal Statistics, May 4, 2021. [Online]. Available: https://www.statista.com/statistics/1028859/europe-secondary-aluminum-production/