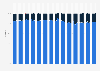
63.5 percent of smartphone owners claiming to have video streaming apps on their devices.
According to a survey conducted in October and November 2018 in Japan, the majority of respondents, around 18 percent, said they currently had six to ten mobile applications installed on their smartphones. The same survey revealed that the most common type of app was video streaming, with around Number of apps consumers have installed on their smartphones in Japan in 2018
Basic Account
Get to know the platform
You only have access to basic statistics.
This statistic is not included in your account.
Starter Account
The ideal entry-level account for individual users
- Instant access to 1m statistics
- Download in XLS, PDF & PNG format
- Detailed references
$199 USD / Month *
Professional Account
Full access
Business Solutions including all features.
* Prices do not include sales tax.
Other statistics that may interest you Statistics on
About the industry
10
- Premium Statistic Popular smartphone game apps Japan as of November 2018
- Premium Statistic Mobile phone features used in France 2017, by gender
- Premium Statistic Survey on ways to transfer money mobile in Finland 2016
- Premium Statistic Survey on usage of authentication methods on mobile devices in Finland 2016
- Premium Statistic Share of mobile or smartphone users doing p-phubbing in Spain in 2014
- Premium Statistic Popular music streaming applications on smartphones Japan 2019
- Premium Statistic Smartphones: number of apps installed Spain 2019
- Premium Statistic Use of mobile phone features in France 2003-2019
- Premium Statistic Number of apps installed on a smartphone in the Nordic countries 2019, by country
- Premium Statistic Number of apps installed on smartphones in the United Kingdom 2019
About the region
10
- Premium Statistic Most commonly used monthly paid smartphone SVoD service Japan 2019
- Premium Statistic Japan - types of smartphone operating systems used for personal purposes 2016-2018
- Premium Statistic Japan - types of mobile operator/carrier used for personal phones 2018
- Premium Statistic Japan - types of mobile phone plans owned 2016-2018
- Premium Statistic Japan - mobile phone features used from 2016 to 2018
- Premium Statistic Japan - types of smartphone operating systems used for business purposes 2016
- Premium Statistic Most popular mobile apps Japan 2023, by category
- Premium Statistic Daily time spent on using the smartphone Japan 2020
- Premium Statistic Daily frequency of sending SMS messages via smartphone Japan 2020
- Premium Statistic Japan - brands of smartphones used for personal purposes 2018
Selected statistics
3
Other regions
10
- Basic Statistic Most popular mobile apps in Russia in H1 2019, by time spent
- Premium Statistic Philippines - types of mobile operator/carrier used for personal phones 2018
- Premium Statistic Willingness to switch to 5G when available MENA 2019, by country
- Premium Statistic Smartphone and tablet users' reasons to uninstall apps in Spain 2016
- Premium Statistic Italy: tourist usage of weather apps by location 2016
- Premium Statistic Colombia - mobile phone features used 2018
- Premium Statistic Taiwan - types of mobile phone plans owned 2017-2018
- Premium Statistic Saudi Arabia - types of mobile operator/carrier used for personal phones 2018
- Premium Statistic Hong Kong - types of mobile operator/carrier used for personal phones 2018
- Premium Statistic Singapore - types of mobile phone plans owned 2017-2018
Related statistics
10
- Premium Statistic Preferred payment method regarding smartphone apps Japan 2023
- Premium Statistic Penetration rate of selected electronic devices among internet users in Japan Q3 2023
- Premium Statistic Household penetration rate of smartphones Japan 2013-2022
- Premium Statistic Average internet usage time of youth per weekday Japan FY 2014-2021
- Premium Statistic Average mobile phone contract expenditure per month Japan 2021, by provider
- Premium Statistic Mobile phone contract expenditure per month at major carriers Japan 2021
- Premium Statistic Mobile phone contract expenditure per month at MVNOs 2021
- Premium Statistic Leading mobile virtual network operators (MVNOs) Japan 2021, by usage rate
- Premium Statistic Most popular mobile phone service used with main device Japan 2021
- Premium Statistic Daily frequency of sending LINE messages via smartphone Japan 2020
Further related statistics
10
- Survey: ownership of mobile devices by U.S. American adults 2011-2012
- Use of mobile devices to make restaurant reservations in the U.S. 2014, by age group
- U.S. cell phone owners who use mobile banking 2013, by ethnicity
- Number of AT&T of connected device subscribers 2009-2023
- Device usage among children to consume media in the United Kingdom (UK) 2013-2019
- Internet usage on a mobile phone in Great Britain 2010-2019, by age
- Podcast consumption on mobile in the U.S. 2017
- ICT Development Index rankings 2017, by country
- Device preference for internet browsing in the United Kingdom (UK) 2015, by age
- Use of smartphones by shoppers in retail stores in Italy in 2015
Further Content: You might find this interesting as well
Statistics
- Survey: ownership of mobile devices by U.S. American adults 2011-2012
- Use of mobile devices to make restaurant reservations in the U.S. 2014, by age group
- U.S. cell phone owners who use mobile banking 2013, by ethnicity
- Number of AT&T of connected device subscribers 2009-2023
- Device usage among children to consume media in the United Kingdom (UK) 2013-2019
- Internet usage on a mobile phone in Great Britain 2010-2019, by age
- Podcast consumption on mobile in the U.S. 2017
- ICT Development Index rankings 2017, by country
- Device preference for internet browsing in the United Kingdom (UK) 2015, by age
- Use of smartphones by shoppers in retail stores in Italy in 2015
MMD Labo. (December 10, 2018). Number of apps consumers have installed on their smartphones in Japan in 2018 [Graph]. In Statista. Retrieved April 26, 2024, from https://www.statista.com/statistics/1030081/japan-number-installed-apps-smartphone/
MMD Labo. "Number of apps consumers have installed on their smartphones in Japan in 2018." Chart. December 10, 2018. Statista. Accessed April 26, 2024. https://www.statista.com/statistics/1030081/japan-number-installed-apps-smartphone/
MMD Labo. (2018). Number of apps consumers have installed on their smartphones in Japan in 2018. Statista. Statista Inc.. Accessed: April 26, 2024. https://www.statista.com/statistics/1030081/japan-number-installed-apps-smartphone/
MMD Labo. "Number of Apps Consumers Have Installed on Their Smartphones in Japan in 2018." Statista, Statista Inc., 10 Dec 2018, https://www.statista.com/statistics/1030081/japan-number-installed-apps-smartphone/
MMD Labo, Number of apps consumers have installed on their smartphones in Japan in 2018 Statista, https://www.statista.com/statistics/1030081/japan-number-installed-apps-smartphone/ (last visited April 26, 2024)
Number of apps consumers have installed on their smartphones in Japan in 2018 [Graph], MMD Labo, December 10, 2018. [Online]. Available: https://www.statista.com/statistics/1030081/japan-number-installed-apps-smartphone/