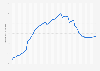
Share of independent workers who provide services to customers outside U.S. 2013-2020
In 2020, 28 percent of independent workers in the United States said they provided goods/services to customers outside the United States. This is a 16 percent increase from 2013 levels, when 12 percent of respondents said they provided goods/services to customers outside the U.S.