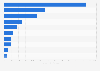
According to a survey conducted from April to July 2020 on preferred payment methods for buying household products in Thailand, 49 percent of the surveyed respondents used cash to pay. In comparison, three percent of such respondents used debit-ATM cards.
Preferred payment methods for purchasing household products in Thailand in 2020
Basic Account
Get to know the platform
You only have access to basic statistics.
This statistic is not included in your account.
Starter Account
The ideal entry-level account for individual users
- Instant access to 1m statistics
- Download in XLS, PDF & PNG format
- Detailed references
$199 USD / Month *
Professional Account
Full access
Business Solutions including all features.
* Prices do not include sales tax.
Other statistics that may interest you Statistics on
About the industry
10
- Premium Statistic Popular payment methods for household products Indonesia 2020
- Premium Statistic Popular payment methods for snack items Indonesia 2020
- Premium Statistic Popular payment methods for buying basic foods and ingredients Thailand 2020
- Premium Statistic Popular payment methods for buying personal care products Thailand 2020
- Premium Statistic Popular payment methods for buying snacks Thailand 2020
- Premium Statistic Popular payment methods for basic foods and ingredients Indonesia 2020
- Premium Statistic Popular payment methods for personal care products Indonesia 2020
- Premium Statistic Most preferred payment methods for online purchases in Nordic countries 2022
- Premium Statistic Most popular payment methods for online purchases in Germany 2022
- Premium Statistic Most popular payment methods for online purchases in France 2021
About the region
10
- Premium Statistic Share of online payment methods Thailand 2022
- Premium Statistic Value of internet banking transactions Thailand 2017-2023
- Premium Statistic Volume of internet banking transactions Thailand 2017-2023
- Premium Statistic Number of new fintech and e-payment businesses Thailand 2018-2020
- Premium Statistic Revenue of fintech and e-payment businesses Thailand 2017-2019
- Premium Statistic Profit of fintech and e-payment businesses Thailand 2017-2018
- Premium Statistic Spending pattern on household appliance Thailand 2021-2023
- Premium Statistic Share of payment methods used by internet users Thailand 2019, by channel
- Premium Statistic Popular stocked-up items during COVID-19 pandemic Thailand 2020
- Premium Statistic Popular stocked-up items during COVID-19 pandemic Thailand 2020, by age
Selected statistics
6
- Premium Statistic Resources shoppers use most often to make purchase decisions in the UK 2013
- Premium Statistic Consumers willingness to share personal data with retailers in the UK in 2013, by age
- Premium Statistic Coffee shops, tea shops and cafes: where consumers go in the United Kingdom (UK) 2013
- Premium Statistic Furniture shopping: Consumers' delivery preferences in the United Kingdom (UK) 2013
- Premium Statistic Where consumers shop for clothing and footwear in the United Kingdom (UK) 2013
- Premium Statistic Channels consumers use for their main grocery shop in the United Kingdom (UK) 2013
Other regions
10
- Premium Statistic Third party payments in China 2012, by type
- Premium Statistic Cashless payments volume for various payment methods in Italy 2020
- Premium Statistic Methods of payment for web browser games in Poland 2020
- Premium Statistic Average online transaction value in India April 2020
- Premium Statistic Leading payment methods used when buying online in France 2019
- Premium Statistic Leading errors preventing consumers from checking out online in Europe 2020
- Premium Statistic Preferred payment methods Philippines 2019
- Premium Statistic Consumer payment methods in Singapore 2015
- Premium Statistic Opinion on increase in e-commerce usage post COVID-19 MENA 2020, by country
- Premium Statistic Distribution of domestic money transfer services 2018, by mobile transaction value
Related statistics
10
- Premium Statistic Share of e-commerce sales Thailand 2019, by traded market
- Premium Statistic Value share of check payments out of non-cash retail transactions Thailand 2011-2015
- Premium Statistic Import value of home electrical appliances Thailand 2023, by product
- Premium Statistic RPI of electronics, furniture, lighting, home item retail stores Thailand 2011-2023
- Premium Statistic Volume of PromptPay transactions Thailand 2017-2023
- Premium Statistic Volume of mobile banking transactions Thailand 2017-2023
- Premium Statistic Value of e-commerce expenditure on consumer goods Thailand 2023, by category
- Premium Statistic Share of weekly e-commerce activities among internet users Thailand Q3 2023
- Premium Statistic Distribution of household spending Thailand H1 2023, by type
- Premium Statistic Value of PromptPay transactions Thailand 2017-2023
Further related statistics
9
- Value of Target2 payments in Eurozone 2008-2021
- Percentage of payments with credit card in China 2013
- LG Electronics revenue by segment 2016-2023, by quarter
- Per capita consumer spending in India 1974-2012
- Life insurance coverage sentiment in the U.S. 2016, by age
- Average wage in artistic occupations in the U.S. 1999-2013
- Loyalty program ownership in U.S. restaurants as of November 2013, by restaurant type
- Hairdressing and beauty: Where consumers access services in the United Kingdom 2013
- Consumers' likelihood of choosing soft drinks in the UK 2012, by gender
Further Content: You might find this interesting as well
Statistics
- Value of Target2 payments in Eurozone 2008-2021
- Percentage of payments with credit card in China 2013
- LG Electronics revenue by segment 2016-2023, by quarter
- Per capita consumer spending in India 1974-2012
- Life insurance coverage sentiment in the U.S. 2016, by age
- Average wage in artistic occupations in the U.S. 1999-2013
- Loyalty program ownership in U.S. restaurants as of November 2013, by restaurant type
- Hairdressing and beauty: Where consumers access services in the United Kingdom 2013
- Consumers' likelihood of choosing soft drinks in the UK 2012, by gender
Marketingoops.com. (May 6, 2020). Preferred payment methods for purchasing household products in Thailand in 2020 [Graph]. In Statista. Retrieved May 03, 2024, from https://www.statista.com/statistics/1233222/thailand-payment-methods-for-household-items/
Marketingoops.com. "Preferred payment methods for purchasing household products in Thailand in 2020." Chart. May 6, 2020. Statista. Accessed May 03, 2024. https://www.statista.com/statistics/1233222/thailand-payment-methods-for-household-items/
Marketingoops.com. (2020). Preferred payment methods for purchasing household products in Thailand in 2020. Statista. Statista Inc.. Accessed: May 03, 2024. https://www.statista.com/statistics/1233222/thailand-payment-methods-for-household-items/
Marketingoops.com. "Preferred Payment Methods for Purchasing Household Products in Thailand in 2020." Statista, Statista Inc., 6 May 2020, https://www.statista.com/statistics/1233222/thailand-payment-methods-for-household-items/
Marketingoops.com, Preferred payment methods for purchasing household products in Thailand in 2020 Statista, https://www.statista.com/statistics/1233222/thailand-payment-methods-for-household-items/ (last visited May 03, 2024)
Preferred payment methods for purchasing household products in Thailand in 2020 [Graph], Marketingoops.com, May 6, 2020. [Online]. Available: https://www.statista.com/statistics/1233222/thailand-payment-methods-for-household-items/