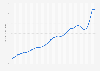
In 2020, the market volume of fitness equipment in Russia reached nearly 10.5 million Russian rubles. In general, the sales revenue increased gradually over the observed period.
Market size of fitness equipment in Russia from 2018 to 2020 (in million Russian rubles)
Basic Account
Get to know the platform
You only have access to basic statistics.
This statistic is not included in your account.
Starter Account
The ideal entry-level account for individual users
- Instant access to 1m statistics
- Download in XLS, PDF & PNG format
- Detailed references
$199 USD / Month *
Professional Account
Full access
Business Solutions including all features.
* Prices do not include sales tax.
Other statistics that may interest you Statistics on
About the industry
9
- Premium Statistic U.S. consumer fitness equipment wholesale sales 2007-2023
- Premium Statistic Revenue of the sports equipment industry in the U.S. 2018-2028
- Premium Statistic Sports equipment market revenue in the U.S. from 2018 to 2028, by product type
- Premium Statistic Institutional fitness equipment wholesale sales in the U.S. 2007-2023
- Premium Statistic U.S. cardiovascular fitness equipment market size in 2017 and 2024, by product type
- Premium Statistic Wholesale sales (consumer segment) of exercise benches in the U.S. 2007-2023
- Basic Statistic Wholesale sales (consumer segment) of rowing machines in the U.S. 2007-2023
- Premium Statistic Wholesale sales of ski machines in the U.S. 2007-2023, consumer segment
- Basic Statistic Wholesale sales of aero gliders in the U.S. 2007-2023, consumer segment
About the region
8
- Premium Statistic Revenue of the digital fitness & well-being devices industry in Russia 2018-2028
- Premium Statistic Health/Fitness club companies - Alex Fitness (Russia) revenue 2012-2019
- Premium Statistic Sporting goods e-store share in Russia H2 2020-H1 2021, by place of registration
- Basic Statistic Home workout equipment sales growth during COVID-19 Russia 2020
- Premium Statistic PaaS market volume in Russia 2013-2022
- Premium Statistic Book market size in Russia 2022, by sales channel
- Premium Statistic Footwear market volume in Russia 2027-2021
- Premium Statistic Average price of wearable devices in Russia 2023, by type
Selected statistics
3
Other regions
10
- Premium Statistic Wholesale sales (consumer segment) of treadmills in the U.S. 2007-2023
- Basic Statistic Home appliances: leading companies in Spain 2018
- Premium Statistic Reasons for doing sports in the Nordic countries 2019
- Premium Statistic Italy: propensity to join low-cost gyms in 2017, by age
- Premium Statistic Brazil: people who practice sports 2015, by sports type
- Premium Statistic Preferred brands for buying sports and fitness accessories in Germany 2016
- Premium Statistic Li Ning's total assets 2014-2022
- Premium Statistic Lack of sports facilities in schools in Vietnam 2019, by type
- Premium Statistic Health/Fitness club companies - Groupe DG / Keep Cool revenue 2014-2019
- Premium Statistic Share of Romanians who buy sports goods in online shops 2019, by age
Related statistics
4
Further related statistics
9
- Alpine ski bindings and boots retail sales in the U.S. 2010-2016
- U.S. snow sports stores snowboard boots retail inventory 2008/09-2012/13
- Sporting goods industry: Net sales of Cybex by product type 2011
- Global net earnings of the Brunswick Corporation 2007-2023
- Global revenue of the Brunswick Corporation 2007-2023
- Overweight prevalence in England 2000-2021, by gender
- Revenue of Shanghai Electric 2010-2021, by sector
- Participants in wrestling in the U.S. from 2006 to 2017
- Printers - U.S. installed base 2010, by type of printer
Further Content: You might find this interesting as well
Statistics
- Alpine ski bindings and boots retail sales in the U.S. 2010-2016
- U.S. snow sports stores snowboard boots retail inventory 2008/09-2012/13
- Sporting goods industry: Net sales of Cybex by product type 2011
- Global net earnings of the Brunswick Corporation 2007-2023
- Global revenue of the Brunswick Corporation 2007-2023
- Overweight prevalence in England 2000-2021, by gender
- Revenue of Shanghai Electric 2010-2021, by sector
- Participants in wrestling in the U.S. from 2006 to 2017
- Printers - U.S. installed base 2010, by type of printer
RBC.ru. (September 23, 2021). Market size of fitness equipment in Russia from 2018 to 2020 (in million Russian rubles) [Graph]. In Statista. Retrieved June 01, 2024, from https://www.statista.com/statistics/1277862/fitness-equipment-market-size-russia/
RBC.ru. "Market size of fitness equipment in Russia from 2018 to 2020 (in million Russian rubles) ." Chart. September 23, 2021. Statista. Accessed June 01, 2024. https://www.statista.com/statistics/1277862/fitness-equipment-market-size-russia/
RBC.ru. (2021). Market size of fitness equipment in Russia from 2018 to 2020 (in million Russian rubles) . Statista. Statista Inc.. Accessed: June 01, 2024. https://www.statista.com/statistics/1277862/fitness-equipment-market-size-russia/
RBC.ru. "Market Size of Fitness Equipment in Russia from 2018 to 2020 (in Million Russian Rubles) ." Statista, Statista Inc., 23 Sep 2021, https://www.statista.com/statistics/1277862/fitness-equipment-market-size-russia/
RBC.ru, Market size of fitness equipment in Russia from 2018 to 2020 (in million Russian rubles) Statista, https://www.statista.com/statistics/1277862/fitness-equipment-market-size-russia/ (last visited June 01, 2024)
Market size of fitness equipment in Russia from 2018 to 2020 (in million Russian rubles) [Graph], RBC.ru, September 23, 2021. [Online]. Available: https://www.statista.com/statistics/1277862/fitness-equipment-market-size-russia/