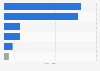
In 2020, the production of sulfur in Algeria amounted to 6,000 metric tons. The production remained stable compared to the previous four years. Previously, it had increased by 1,000 metric tons between 2015 and 2016.
Production of sulfur in Algeria from 2015 to 2020 (in 1,000 metric tons)
Basic Account
Get to know the platform
You only have access to basic statistics.
This statistic is not included in your account.
Starter Account
The ideal entry-level account for individual users
- Instant access to 1m statistics
- Download in XLS, PDF & PNG format
- Detailed references
$199 USD / Month *
Professional Account
Full access
Business Solutions including all features.
* Prices do not include sales tax.
Other statistics that may interest you Statistics on
About the industry
10
- Basic Statistic Global refinery production of cadmium 2023, by country
- Premium Statistic Sodium carbonate import volume in the U.S. 2012-2023
- Basic Statistic Global indium production 2023, by country
- Premium Statistic Sodium carbonate export value in the U.S. 2012-2021
- Premium Statistic Global share of lithium supply 2020-2030, by country
- Basic Statistic SQM's revenue 2010-2022
- Premium Statistic SQM's revenue distributed by segment 2022
- Premium Statistic SQM's number of employees 2010-2022
- Premium Statistic SQM's lithium production 2011-2022
- Basic Statistic Active nonmetal mines in the U.S. 2010-2022
About the region
3
Selected statistics
8
- Premium Statistic Glencore's net income 2010-2023
- Premium Statistic Number of Rio Tinto's employees 2010-2023
- Basic Statistic Rio Tinto's net income 2005-2023
- Premium Statistic Rio Tinto's uranium production 2010-2023
- Basic Statistic Rio Tinto's aluminum and copper production 2010-2023
- Premium Statistic Freeport-McMoRan's revenue 2010-2023
- Basic Statistic Freeport-McMoRan's net income 2010-2023
- Basic Statistic Mine lifespan by selected commodities
Other regions
10
- Premium Statistic Leading global materials sector companies market capitalization 2023
- Premium Statistic Cement production in Africa 2018, by country
- Premium Statistic London Stock Exchange (UK): largest basic materials companies 2023
- Premium Statistic U.S. consumption of minerals per capita by type 2022
- Premium Statistic BASF death toll of selected accidents 1921-2020
- Premium Statistic Import value of total petrochemicals Thailand Q1 2017-Q4 2018
- Premium Statistic Import value of chemicals into Russia in 2018, by commodity
- Premium Statistic Share chemical, chemical products value added GDP Philippines 2009-2018
- Premium Statistic Value of imported chemicals and chemical products into Greenland 2014-2019
- Basic Statistic Asia price of petrochemicals variation during COVID-19 crisis April 2020
Related statistics
10
- Premium Statistic Volume of natural gas production Egypt 2011-2022
- Premium Statistic Value of chemical trade with the EU from Egypt 2017
- Basic Statistic Gold mine production in Egypt 2009-2016
- Premium Statistic Distribution of GDP in Egypt 2021-2022, by sector
- Premium Statistic Economic growth potential in Egypt 2009-2019, by sector
- Premium Statistic Value added per capita of mining and quarrying in Tunisia 2011-2017
- Premium Statistic Value added per capita of mining and quarrying in Libya 2011-2017
- Premium Statistic Value added per capita of mining and quarrying in Egypt 2011-2017
- Premium Statistic Value added per capita of mining and quarrying in Morocco 2011-2017
- Premium Statistic Value of the industry sector as part of GDP Egypt 2017 by sector
Further related statistics
10
- FMC Corporation's net income 2009-2022
- Value of chemical exports: North America 2005-2018
- CF Industries' revenue 2010-2022
- Value of global chemical shipments 2001-2022
- ExxonMobil Chemical products' net income 2001-2023
- Eastman Chemical's: total assets 2010-2020
- CF Industries' total assets 2009-2019
- Praxair's number of employees 2007-2017
- PotashCorp's net income 2007-2017
- Revenue of Saudi Basic Industries by segment 2013-2016
Further Content: You might find this interesting as well
Statistics
- FMC Corporation's net income 2009-2022
- Value of chemical exports: North America 2005-2018
- CF Industries' revenue 2010-2022
- Value of global chemical shipments 2001-2022
- ExxonMobil Chemical products' net income 2001-2023
- Eastman Chemical's: total assets 2010-2020
- CF Industries' total assets 2009-2019
- Praxair's number of employees 2007-2017
- PotashCorp's net income 2007-2017
- Revenue of Saudi Basic Industries by segment 2013-2016
BMLRT (Österreich). (April 27, 2022). Production of sulfur in Algeria from 2015 to 2020 (in 1,000 metric tons) [Graph]. In Statista. Retrieved May 06, 2024, from https://www.statista.com/statistics/1281614/production-of-sulfur-in-algeria/
BMLRT (Österreich). "Production of sulfur in Algeria from 2015 to 2020 (in 1,000 metric tons)." Chart. April 27, 2022. Statista. Accessed May 06, 2024. https://www.statista.com/statistics/1281614/production-of-sulfur-in-algeria/
BMLRT (Österreich). (2022). Production of sulfur in Algeria from 2015 to 2020 (in 1,000 metric tons). Statista. Statista Inc.. Accessed: May 06, 2024. https://www.statista.com/statistics/1281614/production-of-sulfur-in-algeria/
BMLRT (Österreich). "Production of Sulfur in Algeria from 2015 to 2020 (in 1,000 Metric Tons)." Statista, Statista Inc., 27 Apr 2022, https://www.statista.com/statistics/1281614/production-of-sulfur-in-algeria/
BMLRT (Österreich), Production of sulfur in Algeria from 2015 to 2020 (in 1,000 metric tons) Statista, https://www.statista.com/statistics/1281614/production-of-sulfur-in-algeria/ (last visited May 06, 2024)
Production of sulfur in Algeria from 2015 to 2020 (in 1,000 metric tons) [Graph], BMLRT (Österreich), April 27, 2022. [Online]. Available: https://www.statista.com/statistics/1281614/production-of-sulfur-in-algeria/