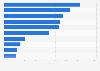
Contribution of medical prescriptions to pharmacy sales Saudi Arabia 2016-2026
In 2026, the contribution of medical prescriptions to pharmacy sales in Saudi Arabia was expected to reach 22.5 percent. In 2016, the contribution of medical prescriptions to pharmacy sales in Saudi Arabia was 19 percent.