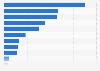
The statistic represents the change in the crude steel production of China and the rest of the world from 2007 to 2009.
Changes in the crude steel production of China and the rest of the world from 2007 to 2009 (in percent)
Basic Account
Get to know the platform
You only have access to basic statistics.
This statistic is not included in your account.
Starter Account
The ideal entry-level account for individual users
- Instant access to 1m statistics
- Download in XLS, PDF & PNG format
- Detailed references
$199 USD / Month *
Professional Account
Full access
Business Solutions including all features.
* Prices do not include sales tax.
Other statistics that may interest you Statistics on
About the industry
10
- Premium Statistic Share of crude steel production in major producing countries and regions 2022
- Premium Statistic Global nickel consumption 2010-2022
- Premium Statistic Global demand for platinum 2005-2023
- Premium Statistic Global steel industry - Nucor Corporation's revenue 2006-2022
- Premium Statistic Global nickel reserves 2023, by country
- Premium Statistic Worldwide supply of palladium 2013-2023
- Premium Statistic Global palladium demand volume 2014-2023
- Premium Statistic Worldwide demand for platinum by region 2019-2023
- Premium Statistic Global palladium demand 2021-2023, by region
- Premium Statistic Nucor's net sales by product category 2021
About the region
10
- Premium Statistic Worldwide supply of platinum 2005-2023
- Premium Statistic AHMSA: net sales 2015-2021
- Premium Statistic AHMSA: net income/loss2015-2021
- Premium Statistic U.S. Steel Corporation's revenue 2012-2021
- Premium Statistic ThyssenKrupp: number of employees 2006-2021
- Premium Statistic Steel industry - global number of Nucor employees 2006-2019
- Premium Statistic Global leading iron ore producing companies based on market capitalization 2019
- Premium Statistic Worldwide dental demand for palladium by region 2013-2018
- Premium Statistic Cash costs plus capex platinum production by region 2016-2018
- Premium Statistic Worldwide chemical demand for platinum and palladium by region 2018
Selected statistics
4
Other regions
10
- Premium Statistic China: production of bullet trains by month 2022-2023
- Premium Statistic GDP share metal components exports Philippines 2009-2018
- Premium Statistic Copper production in Peru 2010-2022
- Premium Statistic North America's leading steel center companies based on revenue 2016
- Premium Statistic Central heating boilers: sales value in the United Kingdom (UK) 2008-2018
- Premium Statistic Qatar Steel's production volume 2019, by product
- Premium Statistic Venezuela: finished steel products demand 2015-2020
- Premium Statistic Apparent steel use per capita in Taiwan 2009-2019
- Premium Statistic Finished steel products demand in Argentina 2015-2021
- Premium Statistic Finished steel products imports in Colombia 2015-2021
Related statistics
10
- Premium Statistic AHMSA: volume of steel products sold 2015-2018
- Premium Statistic AHMSA: liquid steel production 2012-2018
- Premium Statistic Reliance Steel & Aluminum: sales by product as a share of sales 2017
- Basic Statistic U.S. Steel's net sales by product category 2017
- Premium Statistic Leading fabricated metal manufacturers worldwide in 2016
- Premium Statistic Finished steel products demand in Mexico 2015-2022
- Premium Statistic Iron and steel scrap: exports from the U.S. 2006-2022
- Premium Statistic Hot rolled steel products output in Mexico 2000-2022
- Basic Statistic Crude steel production worldwide 2012-2022
- Premium Statistic Croatia: total production of crude steel from 2009-2021
Further related statistics
10
- Number of Rio Tinto's employees 2010-2023
- Rio Tinto's aluminum and copper production 2010-2023
- Comparison of cobalt consumption in the U.S. 2010-2023
- Rare earths demand growth rates for specific industry sectors 2010-2015
- Most visited city parks in the U.S. 2022
- Rio Tinto's net income 2005-2023
- Iron ore prices 2000-2022
- Utilization of the worldwide fish production 2006-2020, by purpose
- Number of people working in fishing and aquaculture worldwide 1995-2020
- Thermal coal prices 2013-2022
Further Content: You might find this interesting as well
Statistics
- Number of Rio Tinto's employees 2010-2023
- Rio Tinto's aluminum and copper production 2010-2023
- Comparison of cobalt consumption in the U.S. 2010-2023
- Rare earths demand growth rates for specific industry sectors 2010-2015
- Most visited city parks in the U.S. 2022
- Rio Tinto's net income 2005-2023
- Iron ore prices 2000-2022
- Utilization of the worldwide fish production 2006-2020, by purpose
- Number of people working in fishing and aquaculture worldwide 1995-2020
- Thermal coal prices 2013-2022
Stahl und Eisen. (May 3, 2010). Changes in the crude steel production of China and the rest of the world from 2007 to 2009 (in percent) [Graph]. In Statista. Retrieved April 20, 2024, from https://www.statista.com/statistics/268012/crude-steel-production-in-china-and-the-world-since-2007/
Stahl und Eisen. "Changes in the crude steel production of China and the rest of the world from 2007 to 2009 (in percent)." Chart. May 3, 2010. Statista. Accessed April 20, 2024. https://www.statista.com/statistics/268012/crude-steel-production-in-china-and-the-world-since-2007/
Stahl und Eisen. (2010). Changes in the crude steel production of China and the rest of the world from 2007 to 2009 (in percent). Statista. Statista Inc.. Accessed: April 20, 2024. https://www.statista.com/statistics/268012/crude-steel-production-in-china-and-the-world-since-2007/
Stahl und Eisen. "Changes in The Crude Steel Production of China and The Rest of The World from 2007 to 2009 (in Percent)." Statista, Statista Inc., 3 May 2010, https://www.statista.com/statistics/268012/crude-steel-production-in-china-and-the-world-since-2007/
Stahl und Eisen, Changes in the crude steel production of China and the rest of the world from 2007 to 2009 (in percent) Statista, https://www.statista.com/statistics/268012/crude-steel-production-in-china-and-the-world-since-2007/ (last visited April 20, 2024)
Changes in the crude steel production of China and the rest of the world from 2007 to 2009 (in percent) [Graph], Stahl und Eisen, May 3, 2010. [Online]. Available: https://www.statista.com/statistics/268012/crude-steel-production-in-china-and-the-world-since-2007/