The statistic shows the average home improvement expenditure in the United States in 2011, by generation. In 2011, average home improvement expenditure among Trailing Baby Boomers in the United States amounted to 8,637 US dollars.
Average home improvement expenditure in the United States in 2011, by generation* (in U.S. dollars)
Basic Account
Get to know the platform
You only have access to basic statistics.
This statistic is not included in your account.
Starter Account
The ideal entry-level account for individual users
- Instant access to 1m statistics
- Download in XLS, PDF & PNG format
- Detailed references
$199 USD / Month *
Professional Account
Full access
Business Solutions including all features.
* Prices do not include sales tax.
Other statistics that may interest you Statistics on
About the industry
10
- Premium Statistic 
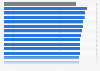
Home improvement - average expenditure in the U.S. 2011, by ethnicity
- Premium Statistic Completed home improvement projects by U.S. homeowners in 2019
- Premium Statistic Challenges faced by homeowners making home improvement projects in 2019
- Premium Statistic Planned home improvement project from U.S. homeowners in 2018
- Premium Statistic Home improvement projects planned in in the United States in 2017, by generation
- Premium Statistic Challenges faced by Millennial homeowners doing home improvement in the U.S. in 2017
- Premium Statistic Challenges faced by Baby boomer homeowners doing home improvement in the U.S. in 2017
- Premium Statistic Planned home improvement spend in the U.S. as of 2017
- Premium Statistic DIY - average expenditure in the U.S. 2011, by ethnicity
- Basic Statistic United States: premium features of upgraded bathtubs in the 2023
About the region
9
- Premium Statistic U.S. adult stroke death rate in 2000 and 2015, by age
- Basic Statistic Age structure in Guam 2022
- Premium Statistic Share of vegetarians in the United States in 2022, by age
- Premium Statistic Type of mobile phone owned by adults in the United States 2019
- Premium Statistic U.S. agency workers - age distribution 2016
- Premium Statistic Share of epilepsy patients taking medication in the U.S. as of 2015, by age
- Basic Statistic U.S. epilepsy patients who became seizure free with medication as of 2015, by age
- Premium Statistic Willingness for consultation with doctor over video U.S. 2016
- Premium Statistic Home buyers in the U.S. 2022, by generation
Selected statistics
4
Other regions
10
- Premium Statistic Countries with the largest percentage of total population over 65 years 2023
- Basic Statistic Median age of the population in Saudi Arabia 2100
- Premium Statistic Age of inbound tourists visiting Poland in 2022
- Premium Statistic Unintentionally homeless households in England (UK) 2016/2017, by age
- Basic Statistic Scotland: sense of belonging to the local community in 2018, by age
- Premium Statistic Religiousness in Great Britain 2014, by age
- Basic Statistic Population distribution in China 2022-2023, by broad age group
- Basic Statistic Share of population aged 65 years and older in Finland 2022, by region
- Basic Statistic Age structure in Liberia 2022
- Basic Statistic Age distribution of the population in Italy 2002-2024
Related statistics
10
- Basic Statistic United States: leading sink styles for master bathroom remodel 2023
- Basic Statistic United States: premium features of upgraded toilets 2023
- Basic Statistic United States: premium features of upgraded shower units 2023
- Basic Statistic United States: master bathroom remodel styles 2023
- Basic Statistic Unites States: high-tech features added to upgraded bathtubs 2023
- Basic Statistic United States: master bathroom renovation color scheme used by surface 2023
- Basic Statistic United States: high-tech features added to upgraded shower units 2023
- Basic Statistic United States: high-tech features added to upgraded toilets 2023
- Premium Statistic Homeowners who planned to renovate their home in Canada 2015-2021
- Premium Statistic Home improvement budget in France 2020, by housing occupancy status
Further related statistics
10
- Mobile internet use via laptops in Great Britain 2019, by demographic
- Survey on most needed changes for the Cuban population 2015
- Employee compensation and benefits at Deutsche Bank 2006-2022
- Retail video market: consumer spending on physical video in France 2008-2022
- U.S. oil and gas industry CAPEX 2010-2022
- Ethical personal products: spending in the United Kingdom (UK) 2011-2021
- Computer software: Online purchasing in Great Britain 2020, by age group
- Consumer expenditure on video and audio equipment in the U.S. 1999-2019
- Per capita consumer spending in India 1974-2012
- Cruise sector: direct expenditures in Europe 2017, by country
Further Content: You might find this interesting as well
Statistics
- Mobile internet use via laptops in Great Britain 2019, by demographic
- Survey on most needed changes for the Cuban population 2015
- Employee compensation and benefits at Deutsche Bank 2006-2022
- Retail video market: consumer spending on physical video in France 2008-2022
- U.S. oil and gas industry CAPEX 2010-2022
- Ethical personal products: spending in the United Kingdom (UK) 2011-2021
- Computer software: Online purchasing in Great Britain 2020, by age group
- Consumer expenditure on video and audio equipment in the U.S. 1999-2019
- Per capita consumer spending in India 1974-2012
- Cruise sector: direct expenditures in Europe 2017, by country
Joint Center for Housing Studies. (January 23, 2013). Average home improvement expenditure in the United States in 2011, by generation* (in U.S. dollars) [Graph]. In Statista. Retrieved April 25, 2024, from https://www.statista.com/statistics/282338/average-home-improvement-expenditure-by-generation/
Joint Center for Housing Studies. "Average home improvement expenditure in the United States in 2011, by generation* (in U.S. dollars)." Chart. January 23, 2013. Statista. Accessed April 25, 2024. https://www.statista.com/statistics/282338/average-home-improvement-expenditure-by-generation/
Joint Center for Housing Studies. (2013). Average home improvement expenditure in the United States in 2011, by generation* (in U.S. dollars). Statista. Statista Inc.. Accessed: April 25, 2024. https://www.statista.com/statistics/282338/average-home-improvement-expenditure-by-generation/
Joint Center for Housing Studies. "Average Home Improvement Expenditure in The United States in 2011, by Generation* (in U.S. Dollars)." Statista, Statista Inc., 23 Jan 2013, https://www.statista.com/statistics/282338/average-home-improvement-expenditure-by-generation/
Joint Center for Housing Studies, Average home improvement expenditure in the United States in 2011, by generation* (in U.S. dollars) Statista, https://www.statista.com/statistics/282338/average-home-improvement-expenditure-by-generation/ (last visited April 25, 2024)
Average home improvement expenditure in the United States in 2011, by generation* (in U.S. dollars) [Graph], Joint Center for Housing Studies, January 23, 2013. [Online]. Available: https://www.statista.com/statistics/282338/average-home-improvement-expenditure-by-generation/