The statistic above represents the percentage of American adults who see differences in what the Republican and Democratic Parties stand for. In 2014, 31 percent of the Millennials say there is a great deal of difference between the Republican and the Democratic parties.
Percentage of American adults who see differences between U.S. parties in 2014, sorted by generation
Loading statistic...
Basic Account
Get to know the platform
You only have access to basic statistics.
Starter Account
The ideal entry-level account for individual users
- Instant access to 1m statistics
- Download in XLS, PDF & PNG format
- Detailed references
$199 USD / Month *
Professional Account
Full access
Business Solutions including all features.
* Prices do not include sales tax.
Other statistics that may interest you Generation X in the U.S.
Life
4
Family and working life
8
- Premium Statistic Number of U.S. households in 2018, by generation
- Premium Statistic Number of U.S. households from 2018-2038, by generation
- Basic Statistic U.S. marriage rate of 23-38 year olds by generation 2020
- Premium Statistic U.S. mean disposable household income 2022, by generation
- Premium Statistic Labor force distribution in the U.S. in 2017, by generation
- Basic Statistic Source of SMB loans among U.S. Generation X owners 2014
- Basic Statistic Percentage of Americans endorsing the increase in older workers 2014, by generation
- Basic Statistic Planned retirement age among members of Generation X 2016
Political views
8
- Basic Statistic U.S. party identification 2022, by generation
- Basic Statistic 
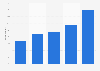
Percentage of Americans who see differences between U.S. parties, by generation 2014
- Basic Statistic Share of patriotic Americans 2014, by generation
- Basic Statistic Opinion of Americans on gun control in 2014, by generation
- Basic Statistic American adults' view of the immigration policy in 2014, by generation
- Basic Statistic Opinion of Americans on same-sex marriage in 2014, by generation
- Basic Statistic U.S. views regarding cause of climate change by generation 2018
- Premium Statistic Share of Gen X consumers using select sources for politcal news U.S. 2014
Consumer behavior
7
- Premium Statistic Food shopping planning habits of U.S. Gen X consumers 2015
- Premium Statistic Holiday shopping: time when U.S. Generation Xers plan to start 2014
- Premium Statistic U.S. share of parents who buy organics by generation 2016
- Premium Statistic Perceived health risks of U.S. Gen X consumers 2015, by type
- Premium Statistic U.S. Gen X shoppers who have used an online channel for groceries 2015-2019
- Basic Statistic Gen X: smartphone retail activities in the United States 2015
- Basic Statistic U.S. Generation X: number of social network users 2013
Further related statistics
17
- Share of contributions to U.S. political parties by industry, election cycle 2018
- Contributions by commercial banks to U.S. political parties in election cycle 2020
- Survey on favorite political parties in Sweden 2017-2022
- Survey on political parties most suited to handle defense policy in Sweden 2021
- UK opinion on political parties keeping their election promises 2016
- Government coalition preferences in the Netherlands 2017
- Spaniards who believed political parties did not represent them by ideology 2019
- Opinion on democracy without parties in Italy 2019, by party preference
- Ranking of political parties in Sweden 2016, by number of mentions
- Share of funds donated to U.S. parties by Fortune 500 companies 2007-2017
- Criteria when deciding to vote for a political party in Spain 2019
- Number of votes won in the United Kingdom general election 2019
- Political parties with the most fans on Facebook in Germany 2017
- Money raised by political parties in 2016 U.S. election cycle
- U.S. voter priority on bills to reduce economic inequality 2020, by PID
- TDS declared by regional political parties in India FY 2012-FY 2016
- EU citizens' choice of political party best representing them in the UK 2019
Further Content: You might find this interesting as well
Statistics
- Share of contributions to U.S. political parties by industry, election cycle 2018
- Contributions by commercial banks to U.S. political parties in election cycle 2020
- Survey on favorite political parties in Sweden 2017-2022
- Survey on political parties most suited to handle defense policy in Sweden 2021
- UK opinion on political parties keeping their election promises 2016
- Government coalition preferences in the Netherlands 2017
- Spaniards who believed political parties did not represent them by ideology 2019
- Opinion on democracy without parties in Italy 2019, by party preference
- Ranking of political parties in Sweden 2016, by number of mentions
- Share of funds donated to U.S. parties by Fortune 500 companies 2007-2017
- Criteria when deciding to vote for a political party in Spain 2019
- Number of votes won in the United Kingdom general election 2019
- Political parties with the most fans on Facebook in Germany 2017
- Money raised by political parties in 2016 U.S. election cycle
- U.S. voter priority on bills to reduce economic inequality 2020, by PID
- TDS declared by regional political parties in India FY 2012-FY 2016
- EU citizens' choice of political party best representing them in the UK 2019
Pew Research Center. (March 7, 2014). Percentage of American adults who see differences between U.S. parties in 2014, sorted by generation [Graph]. In Statista. Retrieved April 18, 2024, from https://www.statista.com/statistics/318935/american-adults-who-see-differences-between-us-parties/
Pew Research Center. "Percentage of American adults who see differences between U.S. parties in 2014, sorted by generation." Chart. March 7, 2014. Statista. Accessed April 18, 2024. https://www.statista.com/statistics/318935/american-adults-who-see-differences-between-us-parties/
Pew Research Center. (2014). Percentage of American adults who see differences between U.S. parties in 2014, sorted by generation. Statista. Statista Inc.. Accessed: April 18, 2024. https://www.statista.com/statistics/318935/american-adults-who-see-differences-between-us-parties/
Pew Research Center. "Percentage of American Adults Who See Differences between U.S. Parties in 2014, Sorted by Generation." Statista, Statista Inc., 7 Mar 2014, https://www.statista.com/statistics/318935/american-adults-who-see-differences-between-us-parties/
Pew Research Center, Percentage of American adults who see differences between U.S. parties in 2014, sorted by generation Statista, https://www.statista.com/statistics/318935/american-adults-who-see-differences-between-us-parties/ (last visited April 18, 2024)
Percentage of American adults who see differences between U.S. parties in 2014, sorted by generation [Graph], Pew Research Center, March 7, 2014. [Online]. Available: https://www.statista.com/statistics/318935/american-adults-who-see-differences-between-us-parties/