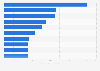
This statistic shows the installed pumped storage hydropower capacity worldwide in 2019, by region. As of that time, Europe's installed pumped storage hydropower capacity amounted to 54,876 megawatts.
Installed pumped storage hydropower capacity worldwide in 2019, by region (in megawatts)
Basic Account
Get to know the platform
You only have access to basic statistics.
This statistic is not included in your account.
Starter Account
The ideal entry-level account for individual users
- Instant access to 1m statistics
- Download in XLS, PDF & PNG format
- Detailed references
$199 USD / Month *
Professional Account
Full access
Business Solutions including all features.
* Prices do not include sales tax.
Other statistics that may interest you Statistics on
About the industry
10
- Premium Statistic Global hydropower generation by region 2022
- Premium Statistic Gross energy production from renewable hydroelectric sources in Italy 2011-2022
- Premium Statistic Largest hydropower producing countries 2022
- Premium Statistic Global hydropower installed capacity 2014-2022
- Premium Statistic Worldwide added new hydropower capacity by region 2022
- Premium Statistic Hydropower global capacity in key countries 2022
- Premium Statistic U.S. Capacity of hydropower project pipeline by status 2018
- Basic Statistic Global pumped storage capacity 2023, by leading country
- Premium Statistic Pumped-storage hydroelectricity generation Spain 2010-2023
- Basic Statistic Canada's share of renewable energy production 2021, by source
About the region
10
- Premium Statistic Global large hydropower capacity factor 2016-2022, by region
- Premium Statistic Hydropower global capacities share 2022, by leading countries
- Premium Statistic Hydropower global capacities added in 2022, by key countries
- Basic Statistic Largest hydroelectric power facilities worldwide 2021
- Premium Statistic Global hydropower plants under construction by expected capacity 2015
- Basic Statistic Global hydropower sector job share by country 2022
- Premium Statistic Global average LCOE of hydropower energy 2010-2022
- Premium Statistic Global hydropower production 2010-2021
- Premium Statistic Hydropower and renewable energy capacity worldwide 2008-2021
- Premium Statistic General Electric revenue from energy segments 2017-2023, by segment
Selected statistics
1
Other regions
10
- Premium Statistic South and Southeastern Asia's capacity of small hydropower by select country 2013
- Premium Statistic Predicted capacity of small hydropower in Canada 2008-2050
- Premium Statistic Italy: distributed generation plants 2016, by type
- Basic Statistic Pumped storage capacity in the U.S. 2010-2023
- Premium Statistic Hydropower consumption in China 2004-2022
- Premium Statistic Russia's outlook for 100% renewable energy transition by source 2050
- Premium Statistic Latin America and the Caribbean: installed energy capacity 2010-2019
- Premium Statistic Brazil: hydropower consumption 2009-2019
- Premium Statistic Outlook for 100 percent renewable energy transition Australia 2050 by source
- Premium Statistic Africa's installed energy capacity 2009-2015
Related statistics
10
- Premium Statistic Largest hydropower plants by capacity in the U.S. 2022
- Premium Statistic Number of conventional hydropower plants in the U.S. 2016-2021
- Premium Statistic Canada's utilization of renewable capacity by resource 2015
- Premium Statistic Public and private U.S. hydropower plants by ownership 2014
- Basic Statistic Share of hydropower capacity Spain 2023, by region
- Premium Statistic Hydroelectricity generation Spain 2010-2023
- Premium Statistic Canada's capacity of hydroelectricity facilities 2022
- Basic Statistic Generation of electricity from renewable sources in England 2003-2022
- Premium Statistic Generation of electricity from renewable sources in Scotland 2003-2022
- Premium Statistic Generation of electricity from renewable sources in Northern Ireland 2003-2022
Further related statistics
10
- Primary energy consumption in China 2012-2022
- Eni S.p.A.'s oil spills from operations 2009-2019
- Eni S.p.A.'s refinery throughputs 2009-2019
- Average retail electricity prices by sector in Florida 1998-2015
- U.S. wind power generation 2009-2040
- Petroleum exports from the U.S. to U.S. Virgin Islands and Puerto Rico
- UK power market: electricity generation market share of UK utilities
- U.S. electricity: noncoincident summer peak load for NERC region MRO
- Coal consumption in South Africa 1998-2022
- RWE's revenue 2008-2022
Further Content: You might find this interesting as well
Statistics
- Primary energy consumption in China 2012-2022
- Eni S.p.A.'s oil spills from operations 2009-2019
- Eni S.p.A.'s refinery throughputs 2009-2019
- Average retail electricity prices by sector in Florida 1998-2015
- U.S. wind power generation 2009-2040
- Petroleum exports from the U.S. to U.S. Virgin Islands and Puerto Rico
- UK power market: electricity generation market share of UK utilities
- U.S. electricity: noncoincident summer peak load for NERC region MRO
- Coal consumption in South Africa 1998-2022
- RWE's revenue 2008-2022
International Hydropower Association. (June 10, 2020). Installed pumped storage hydropower capacity worldwide in 2019, by region (in megawatts) [Graph]. In Statista. Retrieved April 27, 2024, from https://www.statista.com/statistics/585664/installed-pumped-storage-hydropower-capacity-worldwide-by-region/
International Hydropower Association. "Installed pumped storage hydropower capacity worldwide in 2019, by region (in megawatts)." Chart. June 10, 2020. Statista. Accessed April 27, 2024. https://www.statista.com/statistics/585664/installed-pumped-storage-hydropower-capacity-worldwide-by-region/
International Hydropower Association. (2020). Installed pumped storage hydropower capacity worldwide in 2019, by region (in megawatts). Statista. Statista Inc.. Accessed: April 27, 2024. https://www.statista.com/statistics/585664/installed-pumped-storage-hydropower-capacity-worldwide-by-region/
International Hydropower Association. "Installed Pumped Storage Hydropower Capacity Worldwide in 2019, by Region (in Megawatts)." Statista, Statista Inc., 10 Jun 2020, https://www.statista.com/statistics/585664/installed-pumped-storage-hydropower-capacity-worldwide-by-region/
International Hydropower Association, Installed pumped storage hydropower capacity worldwide in 2019, by region (in megawatts) Statista, https://www.statista.com/statistics/585664/installed-pumped-storage-hydropower-capacity-worldwide-by-region/ (last visited April 27, 2024)
Installed pumped storage hydropower capacity worldwide in 2019, by region (in megawatts) [Graph], International Hydropower Association, June 10, 2020. [Online]. Available: https://www.statista.com/statistics/585664/installed-pumped-storage-hydropower-capacity-worldwide-by-region/