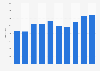
Per capita consumption of bread in Flanders (Belgium) 2008-2017

Per capita consumption volume of bread in Flanders (Belgium) from 2008 to 2017*

Download
Show detailed source information?
Register for free
Already a member?
Log in
Source

Use Ask Statista Research Service

Release date

May 2018

Region

Belgium

Survey time period

2008 to 2017

Number of respondents

2,737 families

Special properties

Flanders only

Supplementary notes

* Figures only take into account consumption at home and excludes for example consumption of bread in restaurants.

Citation formats
Statista Accounts: Access All Statistics. Starting from $2,388 USD / Year
Basic Account
Get to know the platform

You only have access to basic statistics.
This statistic is not included in your account.

Starter Account
The ideal entry-level account for individual users
  • Instant access to 1m statistics
  • Download in XLS, PDF & PNG format
  • Detailed references
$199 USD / Month *
Professional Account
Full access

Business Solutions including all features.

* Prices do not include sales tax.

Other statistics that may interest you Bakery products in Belgium

Production of bakery products

4

Retail sales of bakery products

5

Purchase channels of bakery products

6

Consumption of bakery products

4

Further related statistics

19
Statista Accounts: Access All Statistics. Starting from $2,388 USD / Year
Learn more about how Statista can support your business.