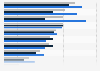
Individuals engaging in leisure activities in the Netherlands 2016, by frequency
The statistic illustrates the individuals engaging in leisure activities in the Netherlands in 2016, by number of times per year. In 2016, approximately ten percent of the respondents mentioned they visit concerts or festivals three times per year.