This statistic represents the change in brand value of the most valuable Australian brands in 2016 compared to 2015. In 2016, the brand value of QBE increased by 48 percent compared to the previous year.
Annual growth of brand value of leading Australian brands in 2016 compared to 2015
Basic Account
Get to know the platform
You only have access to basic statistics.
This statistic is not included in your account.
Starter Account
The ideal entry-level account for individual users
- Instant access to 1m statistics
- Download in XLS, PDF & PNG format
- Detailed references
$199 USD / Month *
Professional Account
Full access
Business Solutions including all features.
* Prices do not include sales tax.
Other statistics that may interest you Statistics on
About the industry
10
- Premium Statistic 
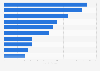
Brand value change of leading brands Australia 2021-2022
- Premium Statistic Brand value change of various industries Australia 2015/2016
- Premium Statistic Brand value Australia 2022, by sector
- Premium Statistic Ranking of alcoholic beverages brands in Poland 2022, by value
- Premium Statistic Ranking of retail brands in Poland 2022, by value
- Premium Statistic Ranking of telecommunications brands in Poland 2022, by value
- Premium Statistic Ranking of clothing and footwear brands in Poland 2022, by value
- Premium Statistic Ranking of cosmetics brands in Poland 2022, by value
- Premium Statistic Ranking of finance brands in Poland 2022, by value
- Premium Statistic Ranking of brands in Poland 2022, by value
About the region
10
- Premium Statistic Sales growth of e-commerce Australia 2023, by category
- Premium Statistic Annual sales growth of clothing e-commerce Australia 2021, by state
- Premium Statistic Annual growth of online variety stores in Australia 2021, by state
- Premium Statistic Annual growth of the online health & beauty market in Australia 2021, by state
- Premium Statistic Annual growth of home & garden e-commerce Australia 2021, by state
- Premium Statistic Annual growth of online recreational goods market in Australia 2021, by state
- Premium Statistic Annual growth of online specialty food and liquor market in Australia 2021, by state
- Premium Statistic Market value of best companies with revenue under one billion Australia 2021
- Premium Statistic Net income of best companies with revenue under one billion Australia 2023
- Premium Statistic Sales value of best companies with revenue under a billion Australia 2021
Other regions
10
- Basic Statistic Global brands with the highest brand value gains 2022
- Premium Statistic Advertising impact of brands on television in Spain 2019
- Premium Statistic Most talked about brands among young people in Finland 2017-2018
- Premium Statistic Leading trusted brands in Canada 2020
- Premium Statistic Leading fashion brands in Italy 2021
- Basic Statistic Brand value of Major League Soccer (USA and Canada) football teams 2012
- Basic Statistic Leading brands in the Netherlands 2018, ranked by Buzz score
- Basic Statistic Brands that make people feel 'Christmassy' in Great Britain 2018
- Premium Statistic Latin America: consequences of brand promise-experience gap 2019
- Premium Statistic Number of new international retail brands in Russia 2012-2019
Related statistics
10
- Premium Statistic Change in ticket sales in the live performance sector Australia 2005-2018
- Premium Statistic Number of indigenous deaths in custody Australia 2008-2023
- Basic Statistic Share of Indigenous Australians who have used substances recently FY2002-2019
- Basic Statistic Distribution of the population in Australia in 2021 by area and indigenous status
- Premium Statistic Deposit interest rate Australia 2010-2019
- Premium Statistic Number of My Health Records in Australia 2018-2023
- Premium Statistic Number of My Health Records with data in Australia 2019-2023
- Basic Statistic Annual revenue of pharmaceutical and cosmetic goods retail Australia 2011-2022
- Basic Statistic Primary and secondary schools Australia 2022 by state
- Basic Statistic Aboriginal and Torres Strait Islander students in Australia 2022 by affiliation
Further related statistics
9
- Market share of the Diet Coke brand in the U.S. 2008-2022
- Market share of the Dr Pepper brand in the U.S. 2008-2022
- Market share of the Sprite brand in the U.S. 2008-2022
- Market share of the Diet Dr Pepper brand in the U.S. 2008-2022
- Market share of the Coke Classic brand in the U.S. 2008-2022
- Global ITO and BPO - Value of industrywide contracts 2012
- Enterprise and brand value of Shoppers Drug Mart in 2012
- Information technology outsourcing market by function 2006-2011
- U.S. chemical industry - output projections 2008-2014
Further Content: You might find this interesting as well
Statistics
- Market share of the Diet Coke brand in the U.S. 2008-2022
- Market share of the Dr Pepper brand in the U.S. 2008-2022
- Market share of the Sprite brand in the U.S. 2008-2022
- Market share of the Diet Dr Pepper brand in the U.S. 2008-2022
- Market share of the Coke Classic brand in the U.S. 2008-2022
- Global ITO and BPO - Value of industrywide contracts 2012
- Enterprise and brand value of Shoppers Drug Mart in 2012
- Information technology outsourcing market by function 2006-2011
- U.S. chemical industry - output projections 2008-2014
Brand Finance. (March 15, 2016). Annual growth of brand value of leading Australian brands in 2016 compared to 2015 [Graph]. In Statista. Retrieved April 23, 2024, from https://www.statista.com/statistics/686392/australia-leading-brands-brand-value-change/
Brand Finance. "Annual growth of brand value of leading Australian brands in 2016 compared to 2015." Chart. March 15, 2016. Statista. Accessed April 23, 2024. https://www.statista.com/statistics/686392/australia-leading-brands-brand-value-change/
Brand Finance. (2016). Annual growth of brand value of leading Australian brands in 2016 compared to 2015. Statista. Statista Inc.. Accessed: April 23, 2024. https://www.statista.com/statistics/686392/australia-leading-brands-brand-value-change/
Brand Finance. "Annual Growth of Brand Value of Leading Australian Brands in 2016 Compared to 2015." Statista, Statista Inc., 15 Mar 2016, https://www.statista.com/statistics/686392/australia-leading-brands-brand-value-change/
Brand Finance, Annual growth of brand value of leading Australian brands in 2016 compared to 2015 Statista, https://www.statista.com/statistics/686392/australia-leading-brands-brand-value-change/ (last visited April 23, 2024)
Annual growth of brand value of leading Australian brands in 2016 compared to 2015 [Graph], Brand Finance, March 15, 2016. [Online]. Available: https://www.statista.com/statistics/686392/australia-leading-brands-brand-value-change/