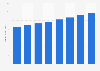
This statistic shows the cost structure distribution of Makalot in Taiwan as of 2016. That year, the Taiwanese apparel company Makalot spent 58 percent of its total expenditure on fabrics.
Cost structure distribution of Makalot in Taiwan as of 2016
Basic Account
Get to know the platform
You only have access to basic statistics.
This statistic is not included in your account.
Starter Account
The ideal entry-level account for individual users
- Instant access to 1m statistics
- Download in XLS, PDF & PNG format
- Detailed references
$199 USD / Month *
Professional Account
Full access
Business Solutions including all features.
* Prices do not include sales tax.
Other statistics that may interest you Statistics on
About the industry
10
- Basic Statistic Skechers' advertising spending worldwide from 2015 to 2023
- Premium Statistic Global brand value comparison of Nike and adidas from 2010 to 2023
- Basic Statistic Total number of stores of Zumiez worldwide from 2011 to 2023
- Premium Statistic Zumiez product category sales share worldwide from 2011 to 2023
- Premium Statistic Zumiez Inc's net sales worldwide from 2011 to 2023, by region
- Basic Statistic Number of stores of Zumiez worldwide in 2024, by country
- Premium Statistic Zumiez Inc's operating profit worldwide from 2011 to 2023
- Basic Statistic Global share of adidas retail sales in 2023, by region
- Premium Statistic Net sales of Skechers worldwide 2011-2023
- Basic Statistic Skechers' number of employees worldwide from 2016 to 2023
About the region
10
- Premium Statistic Share of clients of Feng Tay Taiwan 2016
- Premium Statistic Consumer spending distribution of urban and rural households in China 2023, by use
- Premium Statistic Share of general public budget expenditure for education in Shanxi, China 2010-2022
- Premium Statistic Public expenditure share for social security and employment Shanxi, China 2010-2022
- Premium Statistic Public expenditure share for healthcare and family planning Shanxi, China 2010-2022
- Premium Statistic Ratio of per capita income of urban and rural households in Shanxi, China 2010-2022
- Basic Statistic Nike's revenue in Greater China 2009-2023, by segment
- Premium Statistic Personal consumption expenditure per capita of Hong Kong 2010-2020
- Basic Statistic Penetration rate of sportswear brands in China 2012-2013
- Premium Statistic Li Ning's revenue 2014-2022, by segment
Selected statistics
10
- Basic Statistic Number of Nike stores globally 2009-2023
- Basic Statistic Nike's DTC revenue share worldwide 2011-2015
- Basic Statistic Victoria's Secret's net sales worldwide from 2010 to 2022
- Premium Statistic Footwear retail sales volume trend in Great Britain (UK) 2008-2022
- Basic Statistic Revenues of VF Corporation's active segment worldwide 2016 to 2023
- Premium Statistic Number of Hugo Boss stores worldwide in 2023, by region
- Basic Statistic The adidas Group's global net sales from 2002 to 2023, by product category
- Basic Statistic Net earnings of the Puma Group worldwide from 1993 to 2023
- Basic Statistic Puma Group's market capitalization worldwide 1993-2023
- Basic Statistic Total value of U.S. clothing imports 2011-2022
Other regions
10
- Basic Statistic Under Armour's net income worldwide 2015-2023
- Premium Statistic Average monthly spending on preventive care in urban areas Indonesia 2015-2019
- Basic Statistic Global brand value of adidas from 2016 to 2023
- Premium Statistic Nike's revenue in Western Europe 2009-2017, by segment
- Premium Statistic Nike's revenue in Central and Eastern Europe 2009-2017, by segment
- Basic Statistic Household consumption expenditure in France 1990-2016
- Premium Statistic Market value of sportswear India 2015-2018
- Premium Statistic Directly operated stores of Fast Retailing in Japan FY 2010-2019
- Premium Statistic Sales value of sportswear in Thailand 2011-2016
- Premium Statistic Scottish Gymnastics: expenditure breakdown in Scotland in 2015-2020, by type
Related statistics
10
- Premium Statistic Breakdown of the sportswear market in China 2022, by brand
- Premium Statistic Value of jewelry and precious metals exported from Taiwan 2012-2022
- Premium Statistic Number of textile, apparel and accessories enterprises in China 2013-2022
- Premium Statistic Per capita expenditure of urban households in China on food 2022, by region
- Premium Statistic Leather and fur production value in Taiwan 2012-2022
- Premium Statistic Apparel and clothing accessories production value in Taiwan 2012-2022
- Premium Statistic China retail sales of sportswear 2014-2021
- Premium Statistic Sales of sportswear year-on-year growth rate in China 2014-2019
- Premium Statistic Average monthly spending online in Taiwan 2019, by gender
- Premium Statistic Average monthly spending online in Taiwan 2019, by age group
Further related statistics
10
- Under Armour's operating income worldwide 2008-2023
- Cruise sector: direct expenditures in Europe 2017, by country
- Net sales of Dick's Sporting Goods U.S. 2006-2022
- Employee compensation and benefits at Deutsche Bank 2006-2022
- Retail video market: consumer spending on physical video in France 2008-2022
- U.S. oil and gas industry CAPEX 2010-2022
- Ethical personal products: spending in the United Kingdom (UK) 2011-2021
- Number of Hugo Boss stores worldwide in 2020, by store type
- Consumer expenditure on video and audio equipment in the U.S. 1999-2019
- Per capita consumer spending in India 1974-2012
Further Content: You might find this interesting as well
Statistics
- Under Armour's operating income worldwide 2008-2023
- Cruise sector: direct expenditures in Europe 2017, by country
- Net sales of Dick's Sporting Goods U.S. 2006-2022
- Employee compensation and benefits at Deutsche Bank 2006-2022
- Retail video market: consumer spending on physical video in France 2008-2022
- U.S. oil and gas industry CAPEX 2010-2022
- Ethical personal products: spending in the United Kingdom (UK) 2011-2021
- Number of Hugo Boss stores worldwide in 2020, by store type
- Consumer expenditure on video and audio equipment in the U.S. 1999-2019
- Per capita consumer spending in India 1974-2012
Credit Suisse. (April 15, 2016). Cost structure distribution of Makalot in Taiwan as of 2016 [Graph]. In Statista. Retrieved April 19, 2024, from https://www.statista.com/statistics/736375/taiwan-makalot-cost-structure-share-2016/
Credit Suisse. "Cost structure distribution of Makalot in Taiwan as of 2016." Chart. April 15, 2016. Statista. Accessed April 19, 2024. https://www.statista.com/statistics/736375/taiwan-makalot-cost-structure-share-2016/
Credit Suisse. (2016). Cost structure distribution of Makalot in Taiwan as of 2016. Statista. Statista Inc.. Accessed: April 19, 2024. https://www.statista.com/statistics/736375/taiwan-makalot-cost-structure-share-2016/
Credit Suisse. "Cost Structure Distribution of Makalot in Taiwan as of 2016." Statista, Statista Inc., 15 Apr 2016, https://www.statista.com/statistics/736375/taiwan-makalot-cost-structure-share-2016/
Credit Suisse, Cost structure distribution of Makalot in Taiwan as of 2016 Statista, https://www.statista.com/statistics/736375/taiwan-makalot-cost-structure-share-2016/ (last visited April 19, 2024)
Cost structure distribution of Makalot in Taiwan as of 2016 [Graph], Credit Suisse, April 15, 2016. [Online]. Available: https://www.statista.com/statistics/736375/taiwan-makalot-cost-structure-share-2016/