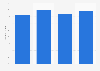
Market share of selected dietary supplement brands in Sweden 2022
This statistic shows the market share of selected dietary supplement brands in Sweden in 2022. That year, the market share of MittVal was highest and amounted to 13 percent, followed by Pharbio with a share of around eight percent. The market share of Probi was 8.1 percent.