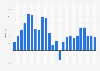
This statistic presents the annual export value of Brazilian metallurgical company Usinas Siderúrgicas de Minas Gerais S.A. (Usiminas) from 2013 to 2016. In 2016, the company's exports amounted to approximately 559 million U.S. dollars, up from around 467 million dollars a year earlier. Usiminas ranked fifth among the
Value of exports of Usinas Siderúrgicas de Minas Gerais (Usiminas) in Brazil from 2013 to 2016 (in million U.S. dollars)
Basic Account
Get to know the platform
You only have access to basic statistics.
This statistic is not included in your account.
Starter Account
The ideal entry-level account for individual users
- Instant access to 1m statistics
- Download in XLS, PDF & PNG format
- Detailed references
$199 USD / Month *
Professional Account
Full access
Business Solutions including all features.
* Prices do not include sales tax.
Other statistics that may interest you Statistics on
About the industry
9
- Basic Statistic Peru: distribution of mining conflicts 2017, by region
- Premium Statistic Brazil: staff at Mineração Usiminas 2013-2016
- Basic Statistic Number of mining conflicts in Latin America 2022, by country
- Basic Statistic Number of mining conflicts in Latin America 2022, by location
- Premium Statistic Leading mining and metallurgical companies in Brazil 2020, by revenue
- Premium Statistic CBMM's ferroniobium export volume in Brazil 2015-2021
- Basic Statistic Net profit of the mining company CBMM 2015-2021
- Premium Statistic Brazil: headcount of CBMM 2015-2021
- Basic Statistic Criminalized mining conflicts in Latin America 2024, by country
About the region
10
- Premium Statistic Net revenue of mining company MRN in Brazil 2013-2022
- Premium Statistic Net revenue of Hydro Paragominas in Brazil 2013-2021
- Premium Statistic Net revenue of AngloGold in Brazil 2013-2021
- Premium Statistic Brazil: net revenue of Mineração Curimbaba 2013-2018
- Premium Statistic Niobium production of CBMM 2021, by product
- Premium Statistic Net assets of the mining company CBMM 2015-2021
- Basic Statistic CBMM's ferroniobium production volume 2015-2021
- Basic Statistic Brazil: net revenue of CSN 2019, by segment
- Premium Statistic Brazil: net revenue of metal company Hydro Alunorte 2013-2017
- Premium Statistic Brazil: net revenue of metal company Novelis 2013-2017
Selected statistics
8
- Basic Statistic Rio Tinto's aluminum and copper production 2010-2023
- Premium Statistic Number of Rio Tinto's employees 2010-2023
- Basic Statistic Rio Tinto's net income 2005-2023
- Premium Statistic Rio Tinto's uranium production 2010-2023
- Premium Statistic Glencore's net income 2010-2023
- Premium Statistic Freeport-McMoRan's revenue 2010-2023
- Basic Statistic Freeport-McMoRan's net income 2010-2023
- Basic Statistic Mine lifespan by selected commodities
Other regions
10
- Premium Statistic Worldwide supply of platinum 2005-2023
- Premium Statistic Largest mining companies in Peru 2022, by beneficiation plant investment
- Premium Statistic Active metal mines in the U.S. 2010-2022
- Premium Statistic Mining workforce in Mexico 2012-2022
- Premium Statistic Iron mine production in Chile 2010-2022
- Premium Statistic Nickel reserves in Canada 1980-2021
- Premium Statistic Distribution of nickel consumption in China by industry 2014
- Premium Statistic Copper production volume in Bolivia 2011-2022
- Premium Statistic Apparent steel use per capita in Taiwan 2009-2019
- Premium Statistic Latin America: largest mining companies 2020, by net sales
Related statistics
10
- Premium Statistic Global demand for platinum 2005-2023
- Premium Statistic Mining direct employment 2022, by region
- Premium Statistic Mining investment value in Peru 2010-2022
- Premium Statistic Mining employment in Peru 2010-2022
- Premium Statistic Worldwide demand for platinum by region 2019-2023
- Premium Statistic Global palladium demand 2021-2023, by region
- Premium Statistic Worldwide supply of palladium 2013-2023
- Premium Statistic Global palladium demand volume 2014-2023
- Premium Statistic Production of iron ore worldwide 2019, by region
- Premium Statistic Worldwide dental demand for palladium by region 2013-2018
Further related statistics
9
- Agnico-Eagle Mines' gold reserves 2000-2022
- Rio Tinto's diamond production 2010-2023
- Freeport-McMoRan's copper production 2010-2023
- Glencore's sales of energy products 2010-2023
- Comparison of cobalt consumption in the U.S. 2010-2023
- Iron ore prices 2000-2022
- Thermal coal prices 2013-2022
- Molycorp's revenue 2008-2014
- Agnico-Eagle Mines' average gold price realized 2010-2022
Further Content: You might find this interesting as well
Statistics
- Agnico-Eagle Mines' gold reserves 2000-2022
- Rio Tinto's diamond production 2010-2023
- Freeport-McMoRan's copper production 2010-2023
- Glencore's sales of energy products 2010-2023
- Comparison of cobalt consumption in the U.S. 2010-2023
- Iron ore prices 2000-2022
- Thermal coal prices 2013-2022
- Molycorp's revenue 2008-2014
- Agnico-Eagle Mines' average gold price realized 2010-2022
Exame. (August 8, 2017). Value of exports of Usinas Siderúrgicas de Minas Gerais (Usiminas) in Brazil from 2013 to 2016 (in million U.S. dollars) [Graph]. In Statista. Retrieved April 29, 2024, from https://www.statista.com/statistics/859194/brazil-usiminas-value-exports/
Exame. "Value of exports of Usinas Siderúrgicas de Minas Gerais (Usiminas) in Brazil from 2013 to 2016 (in million U.S. dollars)." Chart. August 8, 2017. Statista. Accessed April 29, 2024. https://www.statista.com/statistics/859194/brazil-usiminas-value-exports/
Exame. (2017). Value of exports of Usinas Siderúrgicas de Minas Gerais (Usiminas) in Brazil from 2013 to 2016 (in million U.S. dollars). Statista. Statista Inc.. Accessed: April 29, 2024. https://www.statista.com/statistics/859194/brazil-usiminas-value-exports/
Exame. "Value of Exports of Usinas Siderúrgicas De Minas Gerais (Usiminas) in Brazil from 2013 to 2016 (in Million U.S. Dollars)." Statista, Statista Inc., 8 Aug 2017, https://www.statista.com/statistics/859194/brazil-usiminas-value-exports/
Exame, Value of exports of Usinas Siderúrgicas de Minas Gerais (Usiminas) in Brazil from 2013 to 2016 (in million U.S. dollars) Statista, https://www.statista.com/statistics/859194/brazil-usiminas-value-exports/ (last visited April 29, 2024)
Value of exports of Usinas Siderúrgicas de Minas Gerais (Usiminas) in Brazil from 2013 to 2016 (in million U.S. dollars) [Graph], Exame, August 8, 2017. [Online]. Available: https://www.statista.com/statistics/859194/brazil-usiminas-value-exports/