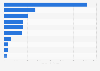
This statistic shows the short term debt to debt ratio for major Chinese sportswear brands in China in 2017. That year, the short term debt to debt ratio for Anta was 100 percent in China.
Percentage of short term debt to debt for major Chinese sportswear brands in China in 2017
Basic Account
Get to know the platform
You only have access to basic statistics.
This statistic is not included in your account.
Starter Account
The ideal entry-level account for individual users
- Instant access to 1m statistics
- Download in XLS, PDF & PNG format
- Detailed references
$199 USD / Month *
Professional Account
Full access
Business Solutions including all features.
* Prices do not include sales tax.
Other statistics that may interest you Statistics on
About the industry
10
- Premium Statistic Average inventory to sales ratio for major Chinese sportswear brands China 2017
- Premium Statistic Gross margins for listed Chinese sportswear brands China 2017
- Premium Statistic Number of stores of sportswear brands China 2017 by type
- Premium Statistic Operating margins of major Chinese sportswear brands China 2017
- Premium Statistic Operating expenses to sales ratio of major Chinese sportswear brands China 2017
- Basic Statistic Global net sales of Columbia Sportswear from 2015 to 2023
- Basic Statistic Global net sales of Columbia Sportswear from 2015 to 2023, by product category
- Basic Statistic Global sales share of Columbia Sportswear in 2023, by product category
- Basic Statistic Global sales share of Columbia Sportswear in 2023, by region
- Basic Statistic Global net sales of Columbia Sportswear from 2018 to 2020, by quarter
About the region
10
- Premium Statistic Number of Weibo followers for major sportswear brands China 2018
- Premium Statistic Retail sales value of Chinese sportswear 2007-2022
- Premium Statistic Value of the global intimate apparel market from 2013 to 2022, by region
- Premium Statistic Value of the U.S., China, and Western Europe apparel and footwear markets in 2019
- Basic Statistic Nike's revenue in Greater China 2009-2023, by segment
- Basic Statistic Fashion: top 5 online stores in Greater China in 2018, by net sales
- Premium Statistic Production volume of intimate apparel from 2013 to 2022, by region
- Premium Statistic Share of consumers in China preferring to buy clothes in stores 2018
- Premium Statistic Natural clothing material preferred among Chinese consumers 2018, by income group
- Premium Statistic Sales revenue of sports-inspired apparel and footwear 2016-2021
Selected statistics
1
Other regions
10
- Premium Statistic Colombia: export value of knit sweaters 2022, by country
- Basic Statistic Global net sales of Foot Locker from 2015 to 2022, by business segment
- Premium Statistic Leading European apparel and accessories retailers 2021, based on global sales
- Premium Statistic Leading fashion products bought online in Spain 2023
- Premium Statistic Distribution of the apparel retail market in the EU 2015, by country
- Premium Statistic Clothing and accessories market value in the UK 2013-2017, by category
- Premium Statistic Mexico: export value of knit sweaters 2022, by country
- Premium Statistic Production value of denim jeans Bangladesh 2012-2021
- Premium Statistic Changes in popularity trends of jewelry, watches and perfumes in Poland 2019-2020
- Premium Statistic Year on year percentage change men's fashion sales turnover in the Netherlands 2018
Related statistics
10
- Premium Statistic Textile production in China by month 2023-2024
- Premium Statistic Revenue of Metersbonwe Group 2012-2022
- Premium Statistic Total assets of Metersbonwe Group 2012-2022
- Premium Statistic Number of employees at parent company of Metersbonwe Group 2012-2022
- Premium Statistic Footwear sales value in China 2012-2022
- Premium Statistic Retail sales of children's wear in China 2012-2021
- Premium Statistic Sales of womenswear in China 2014-2023
- Premium Statistic Production volume of apparel China 2015-2023
- Premium Statistic Profit of apparel enterprises in China 2015-2022
- Premium Statistic Apparel and clothing accessories production value in Taiwan 2012-2022
Further related statistics
10
- Footwear retail sales volume trend in Great Britain (UK) 2008-2022
- The adidas Group's global net sales from 2002 to 2023, by product category
- Number of Hugo Boss stores worldwide in 2023, by region
- Number of Hugo Boss stores worldwide in 2020, by store type
- Nike's DTC revenue share worldwide 2011-2015
- Net sales of Dick's Sporting Goods U.S. 2006-2022
- Victoria's Secret's net sales worldwide from 2010 to 2022
- Hugo Boss - EBITDA 2005-2023
- Puma Group's market capitalization worldwide 1993-2023
- Total value of U.S. clothing imports 2011-2022
Further Content: You might find this interesting as well
Statistics
- Footwear retail sales volume trend in Great Britain (UK) 2008-2022
- The adidas Group's global net sales from 2002 to 2023, by product category
- Number of Hugo Boss stores worldwide in 2023, by region
- Number of Hugo Boss stores worldwide in 2020, by store type
- Nike's DTC revenue share worldwide 2011-2015
- Net sales of Dick's Sporting Goods U.S. 2006-2022
- Victoria's Secret's net sales worldwide from 2010 to 2022
- Hugo Boss - EBITDA 2005-2023
- Puma Group's market capitalization worldwide 1993-2023
- Total value of U.S. clothing imports 2011-2022
GMT Research. (June 12, 2018). Percentage of short term debt to debt for major Chinese sportswear brands in China in 2017 [Graph]. In Statista. Retrieved April 17, 2024, from https://www.statista.com/statistics/915921/china-short-term-debt-to-debt-ratio-for-major-chinese-sportswear-brands/
GMT Research. "Percentage of short term debt to debt for major Chinese sportswear brands in China in 2017." Chart. June 12, 2018. Statista. Accessed April 17, 2024. https://www.statista.com/statistics/915921/china-short-term-debt-to-debt-ratio-for-major-chinese-sportswear-brands/
GMT Research. (2018). Percentage of short term debt to debt for major Chinese sportswear brands in China in 2017. Statista. Statista Inc.. Accessed: April 17, 2024. https://www.statista.com/statistics/915921/china-short-term-debt-to-debt-ratio-for-major-chinese-sportswear-brands/
GMT Research. "Percentage of Short Term Debt to Debt for Major Chinese Sportswear Brands in China in 2017." Statista, Statista Inc., 12 Jun 2018, https://www.statista.com/statistics/915921/china-short-term-debt-to-debt-ratio-for-major-chinese-sportswear-brands/
GMT Research, Percentage of short term debt to debt for major Chinese sportswear brands in China in 2017 Statista, https://www.statista.com/statistics/915921/china-short-term-debt-to-debt-ratio-for-major-chinese-sportswear-brands/ (last visited April 17, 2024)
Percentage of short term debt to debt for major Chinese sportswear brands in China in 2017 [Graph], GMT Research, June 12, 2018. [Online]. Available: https://www.statista.com/statistics/915921/china-short-term-debt-to-debt-ratio-for-major-chinese-sportswear-brands/