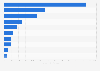
Value of the reusable water bottle market worldwide from 2018 to 2025 (in billion U.S. dollars)*
Basic Account
Get to know the platform
You only have access to basic statistics.
This statistic is not included in your account.
Starter Account
The ideal entry-level account for individual users
- Instant access to 1m statistics
- Download in XLS, PDF & PNG format
- Detailed references
$199 USD / Month *
Professional Account
Full access
Business Solutions including all features.
* Prices do not include sales tax.
Other statistics that may interest you Statistics on
About the industry
10
- Premium Statistic Size of the U.S. reusable water bottle market from 2015 to 2025
- Premium Statistic Size of the U.S. reusable water bottle market from 2015 to 2025, by material
- Premium Statistic Size of the global insulated water bottle market from 2017 to 2026
- Premium Statistic Household penetration of washing machines in the Netherlands 1992-2016
- Premium Statistic Global net sales of Tupperware Brands from 2013 to 2022
- Premium Statistic Global net sales of Tupperware Brands from 2013 to 2022, region
- Premium Statistic Usage of disposable food storage containers in the U.S. 2011-2024
- Premium Statistic Most used brands of food storage containers in the U.S. 2012-2020
- Premium Statistic Glass beverageware products most likely to be purchased among U.S. consumers 2020
- Premium Statistic Price expectations for glass beverageware products among U.S. consumers 2020
About the region
10
- Basic Statistic Global per capita renewable water resources 2022, by country
- Basic Statistic Global drought risk index 2020, by country
- Premium Statistic Global regional freshwater withdrawals forecast by sector 2050
- Premium Statistic Global sales of the leading bottled water companies 2015
- Premium Statistic Highest average tap water prices worldwide 2021, by select city
- Premium Statistic ExxonMobil's freshwater use 2010-2022
- Basic Statistic Global water withdrawals per capita 2021, by select country
- Premium Statistic Coca-Cola's global water withdrawals 2012-2022
- Basic Statistic Xylem: R&D expenses 2016-2021
- Premium Statistic Xylem: revenue 2013-2023
Other regions
10
- Premium Statistic Sales value of bottled water in Canada by type 2018
- Premium Statistic Soft drinks: Bottled water market value in the United Kingdom 2013-2022
- Premium Statistic At-home expenditure on bottled water in Spain 2011-2022
- Premium Statistic Sparkling and mineral water dollar sales in U.S. c-stores 2021, by brand
- Premium Statistic Sales volume of water in Norway 2010-2022, by sales channel
- Premium Statistic Distribution of the beverages consumption in Belgium 2016, by type
- Premium Statistic Flavored water usage in France 2014-2020, by brand type
- Premium Statistic Drinking water import value in South Korea 2015, by origin
- Premium Statistic Change in water consumption in the Netherlands 2017
- Premium Statistic Peru: bottled water per capita consumption volume 2012-2017
Related statistics
9
- Premium Statistic Distribution of household water heaters in the Netherlands 2016, by type
- Premium Statistic Share of households with a bathtub in the Netherlands 2007-2016
- Premium Statistic Sales of food, beverage and tobacco wholesalers in Canada 2012-2023
- Premium Statistic Likelihood to purchase home storage in the next 12 months among U.S. consumers 2020
- Premium Statistic Retail channels most used for beverageware purchases among U.S. consumers as of 2020
- Premium Statistic Key factor when purchasing beverageware among U.S. consumers as of 2020
- Premium Statistic Sales of the leading 20 beer wholesalers in the U.S. 2010
- Premium Statistic United Kingdom: Card Factory like-for-like sales growth 2012-2023
- Premium Statistic World: store count of Home Depot and Lowe's 2011-2023
Further related statistics
10
- French investment in water supply 2010
- Volume of bottled water sold in the U.S. 2010-2022
- Global net sales of Monster Beverage 2008-2022
- Global sales share of Monster Beverage by distribution channel 2010-2022
- Mondelez International's net revenue distribution worldwide by sector 2022
- Mondelez International's operating income worldwide 2011-2022
- Mondelez International's global workforce by region 2012-2022
- Global Lindt & Sprüngli sales 2010-2022
- AB InBev EBITDA margin worldwide by region 2022
- Revenue distribution of the Coca-Cola Company worldwide 2023, by operating segment
Further Content: You might find this interesting as well
Statistics
- French investment in water supply 2010
- Volume of bottled water sold in the U.S. 2010-2022
- Global net sales of Monster Beverage 2008-2022
- Global sales share of Monster Beverage by distribution channel 2010-2022
- Mondelez International's net revenue distribution worldwide by sector 2022
- Mondelez International's operating income worldwide 2011-2022
- Mondelez International's global workforce by region 2012-2022
- Global Lindt & Sprüngli sales 2010-2022
- AB InBev EBITDA margin worldwide by region 2022
- Revenue distribution of the Coca-Cola Company worldwide 2023, by operating segment
Statista. (November 25, 2019). Value of the reusable water bottle market worldwide from 2018 to 2025 (in billion U.S. dollars)* [Graph]. In Statista. Retrieved April 28, 2024, from https://www.statista.com/statistics/935684/reusable-water-bottle-market-value-worldwide/
Statista. "Value of the reusable water bottle market worldwide from 2018 to 2025 (in billion U.S. dollars)*." Chart. November 25, 2019. Statista. Accessed April 28, 2024. https://www.statista.com/statistics/935684/reusable-water-bottle-market-value-worldwide/
Statista. (2019). Value of the reusable water bottle market worldwide from 2018 to 2025 (in billion U.S. dollars)*. Statista. Statista Inc.. Accessed: April 28, 2024. https://www.statista.com/statistics/935684/reusable-water-bottle-market-value-worldwide/
Statista. "Value of The Reusable Water Bottle Market Worldwide from 2018 to 2025 (in Billion U.S. Dollars)*." Statista, Statista Inc., 25 Nov 2019, https://www.statista.com/statistics/935684/reusable-water-bottle-market-value-worldwide/
Statista, Value of the reusable water bottle market worldwide from 2018 to 2025 (in billion U.S. dollars)* Statista, https://www.statista.com/statistics/935684/reusable-water-bottle-market-value-worldwide/ (last visited April 28, 2024)
Value of the reusable water bottle market worldwide from 2018 to 2025 (in billion U.S. dollars)* [Graph], Statista, November 25, 2019. [Online]. Available: https://www.statista.com/statistics/935684/reusable-water-bottle-market-value-worldwide/