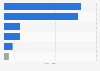
This statistic shows the multifactor productivity index of the mining industry in Australia from financial year 2012 to financial year 2016. During financial year 2016, the mining industry had a multifactor productivity index of 81.1 in the country.
Multifactor productivity index of mining in Australia from financial year 2012 to 2016
Basic Account
Get to know the platform
You only have access to basic statistics.
This statistic is not included in your account.
Starter Account
The ideal entry-level account for individual users
- Instant access to 1m statistics
- Download in XLS, PDF & PNG format
- Detailed references
$199 USD / Month *
Professional Account
Full access
Business Solutions including all features.
* Prices do not include sales tax.
Other statistics that may interest you Statistics on
About the industry
10
- Premium Statistic Anglo American's employment figures 2010-2023
- Premium Statistic Employees in the U.S. mining industry by sector 2022
- Basic Statistic Africa's leading mining companies based on employment 2021
- Basic Statistic U.S. mining industry employment excluding oil and gas 2000-2022
- Premium Statistic BHP's global number of employees 2015-2023
- Basic Statistic BHP's number of employees by region 2022-2023
- Premium Statistic Labor productivity growth in mining and quarrying sector India FY 2013-2019
- Premium Statistic Global mining companies based on number of employees 2023
- Premium Statistic U.S. uranium mining employees 2005-2022
- Basic Statistic Employee fatalities of Vale 2018-2022
About the region
10
- Premium Statistic Leading occupations in the accommodation and food services industry Australia 2021
- Premium Statistic Tourism sector employment Australia FY 2023, by state and type
- Premium Statistic Mental wellness among LGBTQ employees in Australia 2022 by outness
- Premium Statistic Distribution of LGBTQ employees in Australia 2022, by sexual orientation
- Premium Statistic Candor of LGBTQ employees regarding sexual orientation in Australia 2022
- Premium Statistic Feeling of safety and inclusion among LGBTQ employees in Australia 2022
- Premium Statistic Woolworths Group net profit after tax Australia FY 2015-2023
- Premium Statistic Share of education level in rental, hiring and real estate services Australia 2021
- Premium Statistic Share of education level in the construction industry Australia 2021
- Premium Statistic Share of workforce in Australia 2022 by employment profile
Selected statistics
8
- Premium Statistic Number of Rio Tinto's employees 2010-2023
- Premium Statistic Glencore's net income 2010-2023
- Premium Statistic Rio Tinto's uranium production 2010-2023
- Basic Statistic Rio Tinto's aluminum and copper production 2010-2023
- Basic Statistic Rio Tinto's net income 2005-2023
- Premium Statistic Freeport-McMoRan's revenue 2010-2023
- Basic Statistic Freeport-McMoRan's net income 2010-2023
- Basic Statistic Mine lifespan by selected commodities
Other regions
10
- Premium Statistic Liebherr - global number of employees by region 2022
- Premium Statistic Employees opinion on Artificial Intelligence impacts in the working world France 2018
- Premium Statistic Italy: main reasons for companies to activate a company welfare program 2017
- Premium Statistic Number of production businesses UK 2021, by enterprise size
- Premium Statistic Pharma industry workforce in Mexico 2016-2021
- Premium Statistic YoY growth rate FMCG value Asia Q3 2018-Q2 2023, by segment
- Premium Statistic Residential real estate price change in London 2023, by borough and property type
- Premium Statistic Number of private sector businesses in Scotland 2010-2023
- Premium Statistic Number of private sector businesses in Northern Ireland 2010-2023
- Basic Statistic Employment in the finance and insurance sector in Great Britain (UK) 2014-2021
Related statistics
10
- Premium Statistic Value of unpaid overtime in Australia 2020
- Premium Statistic Link Group profit after tax in Australia FY 2015-2019
- Premium Statistic Link Group operating expenses in Australia FY 2015-2019
- Premium Statistic Link Group employee expenses in Australia FY 2015-2019
- Premium Statistic Link Group total revenue in Australia FY 2015-2019
- Premium Statistic Link Group profit before tax in Australia FY 2015-2019
- Premium Statistic Link Group operating EBITDA in Australia FY 2015-2019
- Premium Statistic WorleyParsons employees Australia FY 2014-2019
- Premium Statistic National average first year of employment staff turnover in New Zealand 2012-2018
- Premium Statistic Staff turnover in public organizations by company size in New Zealand 2018
Further related statistics
10
- Number of CBRE Group employees 2009-2022
- Main employment centers of HSBC in 2023, by number of employees
- Johnson & Johnson's number of employees 2004-2023
- Number of employees at Yanzhou Coal Mining 2010-2020
- Number of food-preparation workers in the restaurant industry in the U.S. 2010-2026
- Number of bartenders employed in the restaurant industry in the U.S. 2010-2026
- Number of waiters and waitresses in the restaurant industry in the U.S. 2010-2026
- Reasons restaurant employees took a break from the industry in the U.S. as of 2013
- John Lewis Partnership: number of employees in the United Kingdom (UK) 2009-2023
- Number of employees of Vinci worldwide 1991-2023
Further Content: You might find this interesting as well
Statistics
- Number of CBRE Group employees 2009-2022
- Main employment centers of HSBC in 2023, by number of employees
- Johnson & Johnson's number of employees 2004-2023
- Number of employees at Yanzhou Coal Mining 2010-2020
- Number of food-preparation workers in the restaurant industry in the U.S. 2010-2026
- Number of bartenders employed in the restaurant industry in the U.S. 2010-2026
- Number of waiters and waitresses in the restaurant industry in the U.S. 2010-2026
- Reasons restaurant employees took a break from the industry in the U.S. as of 2013
- John Lewis Partnership: number of employees in the United Kingdom (UK) 2009-2023
- Number of employees of Vinci worldwide 1991-2023
Australian Computer Society. (September 21, 2018). Multifactor productivity index of mining in Australia from financial year 2012 to 2016 [Graph]. In Statista. Retrieved April 27, 2024, from https://www.statista.com/statistics/996792/mining-industry-productivity-australia/
Australian Computer Society. "Multifactor productivity index of mining in Australia from financial year 2012 to 2016." Chart. September 21, 2018. Statista. Accessed April 27, 2024. https://www.statista.com/statistics/996792/mining-industry-productivity-australia/
Australian Computer Society. (2018). Multifactor productivity index of mining in Australia from financial year 2012 to 2016. Statista. Statista Inc.. Accessed: April 27, 2024. https://www.statista.com/statistics/996792/mining-industry-productivity-australia/
Australian Computer Society. "Multifactor Productivity Index of Mining in Australia from Financial Year 2012 to 2016." Statista, Statista Inc., 21 Sep 2018, https://www.statista.com/statistics/996792/mining-industry-productivity-australia/
Australian Computer Society, Multifactor productivity index of mining in Australia from financial year 2012 to 2016 Statista, https://www.statista.com/statistics/996792/mining-industry-productivity-australia/ (last visited April 27, 2024)
Multifactor productivity index of mining in Australia from financial year 2012 to 2016 [Graph], Australian Computer Society, September 21, 2018. [Online]. Available: https://www.statista.com/statistics/996792/mining-industry-productivity-australia/