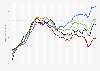
Annual price inflation of non-food sectors in UK by month 2022-2023

Annual price inflation change of non-food products in the United Kingdom (UK) monthly from January 2022 to July 2023, by product category

Download
Show detailed source information?
Register for free
Already a member?
Log in
Source

Use Ask Statista Research Service

Release date

August 2023

Region

United Kingdom

Survey time period

January 2022 to July 2023

Supplementary notes

Figures were collated from the same reports published by the same source in previous periods.

Citation formats
Statista Accounts: Access All Statistics. Starting from $2,388 USD / Year
Basic Account
Get to know the platform

You only have access to basic statistics.
This statistic is not included in your account.

Starter Account
The ideal entry-level account for individual users
  • Instant access to 1m statistics
  • Download in XLS, PDF & PNG format
  • Detailed references
$199 USD / Month *
Professional Account
Full access

Business Solutions including all features.

* Prices do not include sales tax.

Statistics on " Non-food consumer goods prices and price changes worldwide "

Other statistics that may interest you Non-food consumer goods prices and price changes worldwide

Overview

7

Price changes in the U.S.

8

Price changes in Europe

7

Consumer spending behavior

6

Spotlight: Walmart & Target

8
Statista Accounts: Access All Statistics. Starting from $2,388 USD / Year
Learn more about how Statista can support your business.