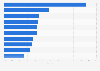
Toyota's net revenue from FY 2012 to FY 2023 (in trillion Japanese yen)
Basic Account
Get to know the platform
You only have access to basic statistics.
This statistic is not included in your account.
Starter Account
The ideal entry-level account for individual users
- Instant access to 1m statistics
- Download in XLS, PDF & PNG format
- Detailed references
$199 USD / Month *
Professional Account
Full access
Business Solutions including all features.
* Prices do not include sales tax.
Other statistics that may interest you Toyota Motor Corporation
Overview
6
- Premium Statistic Most valuable automotive brands worldwide by brand value 2023
- Premium Statistic Ranking of motor vehicle manufacturers worldwide by global sales 2023
- Premium Statistic Leading auto and truck companies worldwide based on revenue 2022
- Premium Statistic Toyota worldwide vehicle production 2007-2023
- Premium Statistic Toyota global vehicle sales 2017-2023
- Basic Statistic Toyota workforce 2012-2023
Financials
6
Segments
6
- Premium Statistic Toyota motor vehicle production by segment 2021-2022
- Premium Statistic Toyota motor vehicle sales in segments 2023
- Premium Statistic Toyota Motor Corporation: motor vehicle sales by region 2017-2023
- Premium Statistic Global unit sales of electrified vehicles of Toyota Motor Corporation 2013-2022
- Premium Statistic Unit sales of electrified vehicles of Toyota Motors Corporation 2022, by region
- Premium Statistic Toyota alternative fuel vehicle sales in segments 2018-2022
Competitors
8
- Premium Statistic Car brand market share worldwide 2023
- Basic Statistic Best-selling car models worldwide in 2023
- Premium Statistic Best selling SUV models worldwide in 2023
- Basic Statistic Volkswagen Group's sales revenue 2006-2023
- Premium Statistic Honda's annual revenue 2002-2023
- Premium Statistic Hyundai Motor Company's sales revenue 2011-2023
- Basic Statistic Kia Corporation: revenue 2009-2023
- Basic Statistic Tesla's revenue 2008-2023
Further related statistics
17
- Toyota's market share of new car registrations in the EU 2021
- Passenger car production of Toyota in Japan - July 2015
- Toyota's passenger car export volume from Japan 2011-2018
- Number of Toyota compact cars registered by model Spain 2018
- Global car production - Toyota's share 2003-2014
- Number of Toyota cars registered in Hong Kong 2019, by year of manufacture
- Toyota cars registered by segment Spain 2018
- Toyota cars registered by model Spain 2018
- Argentina: Toyota Argentina S.A. car production 2010-2018
- Number of Toyota Motor patents by filing year and legal status worldwide 1999-2019
- Toyota light goods vehicles registered in Hong Kong 2019, by year of manufacture
- Sales volume of Toyota cars in the Netherlands 1998-2020
- Number of private cars registrations in Hong Kong 2021, by major maker
- Market share of Toyota cars in the Netherlands 1998-2020
- U.S. franchise dealers - Toyota revenue by segment 2015
- U.S. automotive industry establishments in key states or regions 2015
- Number of licensed drivers in New Hampshire in 2016
Further Content: You might find this interesting as well
Statistics
- Toyota's market share of new car registrations in the EU 2021
- Passenger car production of Toyota in Japan - July 2015
- Toyota's passenger car export volume from Japan 2011-2018
- Number of Toyota compact cars registered by model Spain 2018
- Global car production - Toyota's share 2003-2014
- Number of Toyota cars registered in Hong Kong 2019, by year of manufacture
- Toyota cars registered by segment Spain 2018
- Toyota cars registered by model Spain 2018
- Argentina: Toyota Argentina S.A. car production 2010-2018
- Number of Toyota Motor patents by filing year and legal status worldwide 1999-2019
- Toyota light goods vehicles registered in Hong Kong 2019, by year of manufacture
- Sales volume of Toyota cars in the Netherlands 1998-2020
- Number of private cars registrations in Hong Kong 2021, by major maker
- Market share of Toyota cars in the Netherlands 1998-2020
- U.S. franchise dealers - Toyota revenue by segment 2015
- U.S. automotive industry establishments in key states or regions 2015
- Number of licensed drivers in New Hampshire in 2016
Toyota. (May 10, 2023). Toyota's net revenue from FY 2012 to FY 2023 (in trillion Japanese yen) [Graph]. In Statista. Retrieved April 26, 2024, from https://www.statista.com/statistics/262752/total-net-revenues-of-toyota/
Toyota. "Toyota's net revenue from FY 2012 to FY 2023 (in trillion Japanese yen)." Chart. May 10, 2023. Statista. Accessed April 26, 2024. https://www.statista.com/statistics/262752/total-net-revenues-of-toyota/
Toyota. (2023). Toyota's net revenue from FY 2012 to FY 2023 (in trillion Japanese yen). Statista. Statista Inc.. Accessed: April 26, 2024. https://www.statista.com/statistics/262752/total-net-revenues-of-toyota/
Toyota. "Toyota's Net Revenue from Fy 2012 to Fy 2023 (in Trillion Japanese Yen)." Statista, Statista Inc., 10 May 2023, https://www.statista.com/statistics/262752/total-net-revenues-of-toyota/
Toyota, Toyota's net revenue from FY 2012 to FY 2023 (in trillion Japanese yen) Statista, https://www.statista.com/statistics/262752/total-net-revenues-of-toyota/ (last visited April 26, 2024)
Toyota's net revenue from FY 2012 to FY 2023 (in trillion Japanese yen) [Graph], Toyota, May 10, 2023. [Online]. Available: https://www.statista.com/statistics/262752/total-net-revenues-of-toyota/