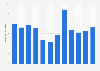
The table shows SABMiller's sales volume of soft drinks worldwide in 2016, by region. In that year, SABMiller's soft drink sales volume in Europe amounted to about 15.78 million hectoliters.
SABMiller's sales volume of soft drinks in 2016, by region (in 1,000 hectoliters)
Basic Account
Get to know the platform
You only have access to basic statistics.
This statistic is not included in your account.
Starter Account
The ideal entry-level account for individual users
- Instant access to 1m statistics
- Download in XLS, PDF & PNG format
- Detailed references
$199 USD / Month *
Professional Account
Full access
Business Solutions including all features.
* Prices do not include sales tax.
Other statistics that may interest you Statistics on
About the industry
10
- Premium Statistic EU: turnover per employee in fruit and vegetable juice manufacturing 2016, by country
- Premium Statistic Personnel costs of fruit juice manufacturing industry in the EU 2013-2016, by country
- Basic Statistic Full-calorie and diet soda consumption share worldwide by region 2013
- Basic Statistic Revenue distribution of the Coca-Cola Company worldwide 2023, by operating segment
- Premium Statistic Coca-Cola's global workforce 2007-2023
- Premium Statistic Eating out: Weekly UK consumption of milk-based soft drinks 2006-2022
- Premium Statistic Employees in the manufacture of soft drinks and waters industry in Denmark 2010-2022
- Premium Statistic EU countries: employees in fruit and vegetable juice manufacturing industry 2020
- Premium Statistic Soft drinks: Consumption of carbonated drinks in the United Kingdom 2013-2022
- Premium Statistic Volume of soft drinks available for consumption per person in Canada 2011-2022
About the region
10
- Premium Statistic Operating profit of SABMiller worldwide 2016, by region
- Premium Statistic Revenue of Anheuser-Busch InBev worldwide 2005-2023
- Premium Statistic SABMiller's sales volume of lager worldwide 2016, by region
- Premium Statistic SABMiller's group revenue worldwide 2016, by region
- Basic Statistic SABMiller's EBITA margin worldwide 2016, by region
- Premium Statistic Beer market: SABMiller's number of breweries worldwide by region 2011-2012
- Premium Statistic Global beer consumption: five-year CAGR 2015-2020, by region
- Premium Statistic SABMiller's number of employees 2016, by region
- Premium Statistic Constellation Brands: beer net sales worldwide 2011-2022
- Premium Statistic Constellation Brands: number of employees worldwide 2013-2022
Selected statistics
4
Other regions
10
- Premium Statistic Dollar sales of the leading craft beer brands in the U.S. 2022
- Premium Statistic Average number of employees of Harboe Bryggeri 2012-2021
- Premium Statistic Number of AB Inbev production plants in North America by country 2009-2015
- Premium Statistic Number of employees at Yanghe Brewery China 2012-2022
- Premium Statistic Average price of bottled beer in Singapore 2009-2020
- Premium Statistic Mexico: leading reasons for consuming craft beer 2017
- Premium Statistic Turnover of food and beverage manufacturing Australia FY 2016, by product
- Basic Statistic Sales volume of beers in France 2017, by type of packaging
- Premium Statistic Brazil: malt beer export value 2008-2018
- Premium Statistic Share of craft beer sold on promotion in the Netherlands 2019, by type
Related statistics
10
- Premium Statistic Distribution of employees of the Carlsberg Group 2022, by region
- Premium Statistic Consumer price index (CPI) of beer in Norway 2012-2022
- Premium Statistic Employees in the manufacture of beer industry in Denmark 2010-2021
- Premium Statistic Employees in specialized retail sale of beverages in Denmark 2010-2022
- Premium Statistic Annual number of employees of Systembolaget in Sweden 2009-2021
- Premium Statistic Average number of employees of Royal Unibrew 2012-2021
- Premium Statistic Market share of Spendrups Bryggeri in Sweden 2017, by product category
- Basic Statistic Beer consumer price index (CPI) monthly in Sweden 2021-2022
- Premium Statistic Average number of employees of the Carlsberg Group 2011-2022
- Premium Statistic Hot beverage consumption outside the home in the United Kingdom (UK) 2006-2022
Further related statistics
10
- AB InBev EBITDA margin worldwide by region 2022
- Number of bartenders employed in the restaurant industry in the U.S. 2010-2026
- John Lewis Partnership: number of employees in the United Kingdom (UK) 2009-2023
- Mondelez International's global workforce by region 2012-2022
- Number of employees of the adidas Group worldwide from 2000 to 2023
- Air Liquide's number of employees 2005-2023
- Number of employees of the InterContinental Hotel Group 2023
- Number of CBRE Group employees 2009-2022
- Number of employees at HSBC 2010-2023
- Main employment centers of HSBC in 2023, by number of employees
Further Content: You might find this interesting as well
Statistics
- AB InBev EBITDA margin worldwide by region 2022
- Number of bartenders employed in the restaurant industry in the U.S. 2010-2026
- John Lewis Partnership: number of employees in the United Kingdom (UK) 2009-2023
- Mondelez International's global workforce by region 2012-2022
- Number of employees of the adidas Group worldwide from 2000 to 2023
- Air Liquide's number of employees 2005-2023
- Number of employees of the InterContinental Hotel Group 2023
- Number of CBRE Group employees 2009-2022
- Number of employees at HSBC 2010-2023
- Main employment centers of HSBC in 2023, by number of employees
SABMiller. (June 22, 2016). SABMiller's sales volume of soft drinks in 2016, by region (in 1,000 hectoliters) [Graph]. In Statista. Retrieved April 29, 2024, from https://www.statista.com/statistics/269574/sabmillers-soft-drink-sales-volumes-in-selected-regions/
SABMiller. "SABMiller's sales volume of soft drinks in 2016, by region (in 1,000 hectoliters)." Chart. June 22, 2016. Statista. Accessed April 29, 2024. https://www.statista.com/statistics/269574/sabmillers-soft-drink-sales-volumes-in-selected-regions/
SABMiller. (2016). SABMiller's sales volume of soft drinks in 2016, by region (in 1,000 hectoliters). Statista. Statista Inc.. Accessed: April 29, 2024. https://www.statista.com/statistics/269574/sabmillers-soft-drink-sales-volumes-in-selected-regions/
SABMiller. "Sabmiller's Sales Volume of Soft Drinks in 2016, by Region (in 1,000 Hectoliters)." Statista, Statista Inc., 22 Jun 2016, https://www.statista.com/statistics/269574/sabmillers-soft-drink-sales-volumes-in-selected-regions/
SABMiller, SABMiller's sales volume of soft drinks in 2016, by region (in 1,000 hectoliters) Statista, https://www.statista.com/statistics/269574/sabmillers-soft-drink-sales-volumes-in-selected-regions/ (last visited April 29, 2024)
SABMiller's sales volume of soft drinks in 2016, by region (in 1,000 hectoliters) [Graph], SABMiller, June 22, 2016. [Online]. Available: https://www.statista.com/statistics/269574/sabmillers-soft-drink-sales-volumes-in-selected-regions/