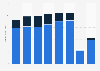
The statistic illustrates the number of overseas contracts with Japanese animation companies in 2014, ranked by region. During the measured period, Japanese animation companies had the highest number of contracts with South Korea and the United States. Taiwan ranked second with 76 contracts as of 2014.
Number of overseas contracts with Japanese animation companies in 2014, by country
Basic Account
Get to know the platform
You only have access to basic statistics.
This statistic is not included in your account.
Starter Account
The ideal entry-level account for individual users
- Instant access to 1m statistics
- Download in XLS, PDF & PNG format
- Detailed references
$199 USD / Month *
Professional Account
Full access
Business Solutions including all features.
* Prices do not include sales tax.
Other statistics that may interest you Statistics on
About the industry
10
- Premium Statistic Animation consumer spending in Japan 1980-2017
- Premium Statistic Revenue distribution of animation production companies in Japan 2021, by segment
- Premium Statistic Revenue of anime production companies Japan 2022, by segment
- Premium Statistic Revenue of the anime industry Japan 2022, by segment
- Premium Statistic Manga industry production value in China 2010-2015
- Premium Statistic Anime-related live entertainment market size Japan 2013-2022
- Premium Statistic Anime videogram market size Japan 2013-2022
- Premium Statistic Number of video rental stores in Japan 2014-2023
- Basic Statistic Number of employees in the film, video, and TV program industries in Sweden 2019-2023
- Basic Statistic Hourly wages in the U.S. motion picture and video industries 2022
About the region
10
- Premium Statistic Manga publications sales volume Japan 2017, by type
- Premium Statistic Average annual salaries in the anime industry in Japan 2015, by position
- Premium Statistic Average monthly salaries in the anime industry in Japan 2015, by position
- Premium Statistic Leading manga titles in Japan in 2014, by number of copies published
- Premium Statistic Most successful animated films in Japan 2023, based on box office gross
- Premium Statistic Number of Japanese movies shown at theaters in Japan 2014-2023
- Premium Statistic Japanese movies box office gross in Japan 2014-2023
- Premium Statistic TV anime broadcasting market size Japan 2013-2022
- Premium Statistic Production minutes of daytime and late-night TV anime Japan 2013-2022
- Premium Statistic Leading manga series in Japan 2022, based on sales volume
Other regions
10
- Basic Statistic Content spend of major SVoD services 2013-2018
- Premium Statistic Number of animated movie production companies in France 2004-2021
- Premium Statistic Revenue of the motion picture and video industry in the U.S. 2021, by source
- Premium Statistic TV production costs for various ZDF shows in Germany 2021
- Premium Statistic Television consumption distribution in Italy 2018, by age group
- Premium Statistic In-demand jobs in ACG game sector in China H1 2019, by category
- Premium Statistic Domestic cinema movies available on streaming services in Norway 2015-2017
- Premium Statistic Movie export value in South Korea 2023, by region
- Premium Statistic Value of the film industry in India FY 2014-2024
- Premium Statistic Annual production value of domestic films in the Netherlands 2022, by type
Related statistics
10
- Premium Statistic Video game console sales value share in Japan 2017, by brand
- Premium Statistic Most successful movies in Japan 2023, based on box office gross
- Premium Statistic Number of imported movies shown at theaters in Japan 2014-2023
- Premium Statistic Number of cinema admissions in Japan 2014-2023
- Premium Statistic Number of cinema screens 2023, by prefecture
- Premium Statistic Average ticket price in Japanese cinemas 2014-2023
- Premium Statistic Number of 3D cinema screens 2023, by prefecture
- Premium Statistic Total box office gross in Japan 2014-2023
- Premium Statistic Number of screens in cinema complexes 2023, by prefecture
- Premium Statistic Imported movies box office gross in Japan 2014-2023
Further related statistics
10
- Comic book reading by young people in the United Kingdom 2017-2023, by format
- Primary energy consumption in China 2012-2022
- Fragrance market value in Great Britain 2022, by product type
- Skincare market value in Great Britain 2022, by product type
- Toiletry market value in Great Britain 2022, by product type
- Skincare market value in Great Britain 2009-2022
- Ethical personal products: spending in the United Kingdom (UK) 2011-2021
- EBIT of Nestlé Waters worldwide 2007-2019
- Nestlé Waters' sales distribution share worldwide 2010-2019
- Most searched hair care brands on Baidu in China Q3 2013
Further Content: You might find this interesting as well
Statistics
- Comic book reading by young people in the United Kingdom 2017-2023, by format
- Primary energy consumption in China 2012-2022
- Fragrance market value in Great Britain 2022, by product type
- Skincare market value in Great Britain 2022, by product type
- Toiletry market value in Great Britain 2022, by product type
- Skincare market value in Great Britain 2009-2022
- Ethical personal products: spending in the United Kingdom (UK) 2011-2021
- EBIT of Nestlé Waters worldwide 2007-2019
- Nestlé Waters' sales distribution share worldwide 2010-2019
- Most searched hair care brands on Baidu in China Q3 2013
Dentsu. (February 28, 2016). Number of overseas contracts with Japanese animation companies in 2014, by country [Graph]. In Statista. Retrieved April 29, 2024, from https://www.statista.com/statistics/689038/japan-domestic-animation-companies-overseas-contracts-by-country/
Dentsu. "Number of overseas contracts with Japanese animation companies in 2014, by country." Chart. February 28, 2016. Statista. Accessed April 29, 2024. https://www.statista.com/statistics/689038/japan-domestic-animation-companies-overseas-contracts-by-country/
Dentsu. (2016). Number of overseas contracts with Japanese animation companies in 2014, by country. Statista. Statista Inc.. Accessed: April 29, 2024. https://www.statista.com/statistics/689038/japan-domestic-animation-companies-overseas-contracts-by-country/
Dentsu. "Number of Overseas Contracts with Japanese Animation Companies in 2014, by Country." Statista, Statista Inc., 28 Feb 2016, https://www.statista.com/statistics/689038/japan-domestic-animation-companies-overseas-contracts-by-country/
Dentsu, Number of overseas contracts with Japanese animation companies in 2014, by country Statista, https://www.statista.com/statistics/689038/japan-domestic-animation-companies-overseas-contracts-by-country/ (last visited April 29, 2024)
Number of overseas contracts with Japanese animation companies in 2014, by country [Graph], Dentsu, February 28, 2016. [Online]. Available: https://www.statista.com/statistics/689038/japan-domestic-animation-companies-overseas-contracts-by-country/